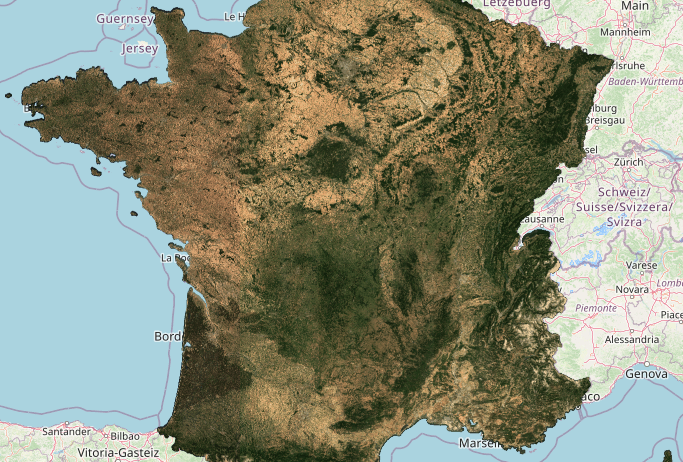
After 6 years of Copernicus data, I have never seen France that yellow
What can we say, except that the vegetation situation in France has worsened significantly in July 2022 compared to an already alarming June. The monthly syntheses of Sentinel-2 for the month of July are available since a few days, and the comparison with previous years shows an exceptional drought on the whole territory. Only 2019 competes in places with 2022, but this year the drought extends to almost the entire territory.
The data can be viewed and compared at full resolution (10 m over France) on the THEIA map server:
We give a few examples here, but feel free to go and see for yourself, the server allows to zoom in at 10m resolution.
Situation nationale

Although 2018 and 2019 had displayed strong vegetation yellowing, never since 2017 and before 2022 had it spread across the entire country. This yellowing signal cumulates several effects : crops may be ahead of schedule and thus reach the senescent stage, and may be harvested earlier, or vegetation may dry out and yellow before reaching full development. The interpretation of this data is tricky without land use information.
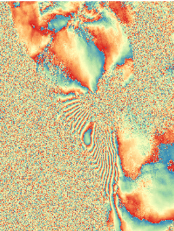
Below, you can compare the two most recent years with severe drought, 2019 and 2022 :
Some regional examples :

Brittany is among the territories generally spared by drought, but its grasslands have been affected by the exceptional drought this year.
In Toulouse, everything is dry, as we can see from CESBIO’s windows. Forests are seriously starting to yellow in areas with shallow soil depths, but this signal will probably be more visible on August images.

Vendée was affected early in 2022, but some rains seem to have improved the situation slightly, which now looks like 2019 (which was quite catastrophic).
Methods
I had explained in several posts how these products are generated. They average the surface reflectances for non-cloudy observations over 45 days, and are therefore dependent on the quality of the cloud masks and atmospheric corrections. For 2022, we could have made syntheses on less than 15 days, but we kept the 45 days value to keep a good comparison with years with more clouds. This explains the late publication of these data (with my low availability and my late return from holidays 🙂 ).
The complete data, with all bands, and at full resolution, can also be downloaded from Theia’s distribution site. The processors used to produce those almost seamless syntheses are MAJA, for cloud detection and atmospheric correction, and WASP, for the monthly syntheses. These processors have been developed by CNES and CS-GROUP, using processing methods developed at CESBIO.