My remote sensing analyses on Twitter. Part 1: floods
S. P. Hicks (@seismo_steve) wrote for Nature Geoscience a nice piece « Geoscience analysis on Twitter » where he shares his experience on using Twitter for the real time analysis of geohazards.
Actively using Twitter for science may be perceived by some as a significant time-sink — the demands on individual researchers and their institutions at times of newsworthy events can be very high — but it is ultimately rewarding.
I fully agree with his viewpoint and I would like to share my experience here too.
As a trained hydrologist I’m inclined to tweet about water-related hazards like floods and droughts. However, I have mostly tweeted on floods because flooded surfaces can be easily characterized by remote sensing using a simple before/after image comparison. In particular, water surfaces are strong reflectors of the electromagnetic waves emitted by SAR satellites such as Sentinel-1. In addition SAR sensors can see through the clouds which is a key asset for near-real time analysis during flooding events.
(1/n) Annotated map of the Xe-Namnoi dam breach. The flood came from a saddle dam breach and followed the Vang Ngao river down to the villages. @CopernicusEU #Laosdam pic.twitter.com/Vtay6iXrCY
— Simon Gascoin (@sgascoin) July 25, 2018
I remember that I made this analysis of the Xe-Namnoi dam failure overnight, just hours after the first Sentinel-1 image of the flood was available on the Sentinel Hub. My tweets triggered many interesting discussions with other flood specialists, civil engineers and NGO staff, but also with close colleagues at LEGOS who provided water elevation data from Sentinel-3 to expand the analysis. My animation and other images were featured in ESA’s website (here and here, without acknowledging my work though). This post was the most visited in 2018 (11,371 visits, 18% of the 2018 visits).
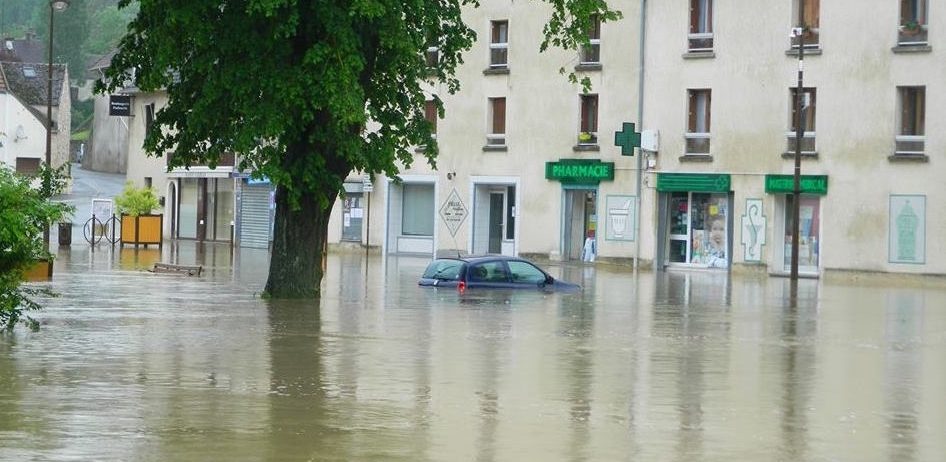
SAR images are great, but optical sensors like Sentinel-2 can also provide useful observations of flooded areas as shown below in the case of the recent flood in southwest France:
Les inondations dans le Sud-Ouest de la France vues par le satellite #Sentinel2https://t.co/eMY4aNcpIF @sudouest @ladepechedumidi @CNES @ESA_fr pic.twitter.com/vAA3SxJ4WP
— Simon Gascoin (@sgascoin) December 16, 2019
To go a bit further with optical data, the NDWI is a simple a simple multispectral index, which makes it is easy to map the extent of the water surface:
Using the NDWI to map #flooding in the Central US
Blog post: https://t.co/1KONmu1c2L @CopernicusEU @esascience pic.twitter.com/dQmPT8u57P— Simon Gascoin (@sgascoin) May 4, 2017
I used the same method to show the Oroville dam lake extent when it was under the threat of spillway failure, causing the evacuation of 188’000 northern California residents.
Lake Oroville in January 2016 vs. 2017 from #Sentinel2 imagery #OrovilleDam @CopernicusEU https://t.co/bW3hGMlKrS pic.twitter.com/R5nusxOpJH
— Simon Gascoin (@sgascoin) February 13, 2017
In the case of the dramatic 2019 Omaha flood, I tried to go beyond the visualization of the flooded areas ..
Just a comparison with last year helps figure out the huge extent of the flooded areas around Omaha, Nebraska #NebraskaFlood #OmahaFlood Imagery: @CopernicusEU #Sentinel2 pic.twitter.com/8XFjSnWpoL
— Simon Gascoin (@sgascoin) March 17, 2019
.. using additional images and weather data it was obvious that the flood was caused by a rain-on-snow event:
1/2 #Sentinel2 shows extensive snow melt around Omaha, Nebraska.. in only 5 days! #nebraskaflooding pic.twitter.com/izaPfoRoQX
— Simon Gascoin (@sgascoin) March 17, 2019
To conclude this post, an interesting fact is that my least successful tweet about flood is the one below (only 1 « like » at the time of writing), probably because I was a newbie in Twitter at that time. However, the linked article is one of the most visited page (if not the most visited) in this blog. Twitter isn’t the only way to reach out to people!
Mapping flooded areas using Sentinel-1 in Google Earth Engine https://t.co/sulbryPXwX
— Simon Gascoin (@sgascoin) June 10, 2016
The next article will be about landslides [here]. In the meantime, here are some more flood tweets:
In France…
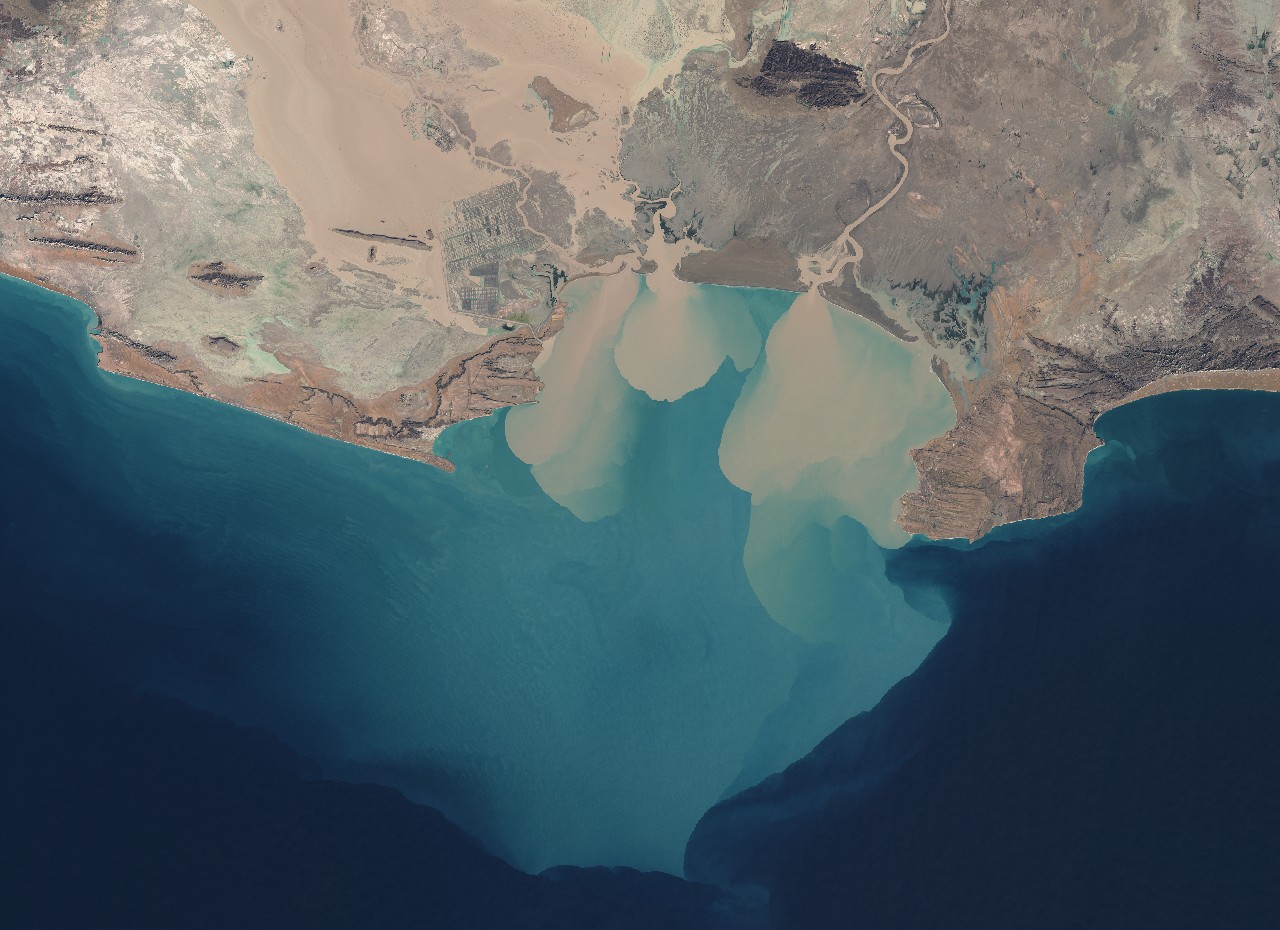
Image prise par le satellite #Sentinel2 des panaches de sédiments dans la Méditerranée entre Béziers et Agde après les fortes pluies qui se sont abattues sur le sud de la France les 22 et 23 octobre. Source: @CopernicusEU @lindependant @ladepechedumidi pic.twitter.com/hB1lvLBDkJ
— Simon Gascoin (@sgascoin) October 27, 2019
Italy…
Flood in #Livorno #Sentinel2 on Sep 04 and Sep 11 pic.twitter.com/9pqbONLIkX
— Simon Gascoin (@sgascoin) September 12, 2017
Mozambique…
Flooded areas near Beira on 19 Mar 2019 computed from #Sentinel1 #MozambiqueFloods@CopernicusEMS @CopernicusEU pic.twitter.com/2OdE6Ixzig
— Simon Gascoin (@sgascoin) March 20, 2019
Australia…
The after/before of the 2017 Queensland floods in #Sentinel2 imagery https://t.co/R8x6DfyLxM #QLDfloods @BOM_Qld pic.twitter.com/0SozZ3VzzU
— Simon Gascoin (@sgascoin) May 2, 2017
USA…
Flooded areas near Highway 90 and Dayton TX (July 24 vs. Aug 29) #Sentinel1 #HarveyFlood pic.twitter.com/z3S1SvYcE5
— Simon Gascoin (@sgascoin) August 29, 2017
India…
The NDWI layer in the @sentinel_hub reveals the extent of the flooded areas in Kerala @CopernicusEU @ESA_EO #KeralaFloods pic.twitter.com/qNKbgM2fRF
— Simon Gascoin (@sgascoin) August 28, 2018
Spain… Sometimes remote sensing is not useful:
There will be .. flood!
The latest report just released by the Ebro river basin agency shows that the 1st April snow water equivalent is very large in the #Pyrenees catchments. It is actually the highest value since the beginning of the record in 2002. pic.twitter.com/FGPUwgcIQy— Simon Gascoin (@sgascoin) April 3, 2018
Prediction was correct…
https://twitter.com/FotografiaPais/status/985257636592414720?ref_src=twsrc%5Etfw