Land cover map production: how it works
 =>
=> 
Land cover and land use maps
Classical production approaches
The automatic approaches to land cover map production using remote sensing imagery are often based on image classification methods. This classification can be:
- supervised: areas for which the land cover is known are used as learning examples;
- unsupervised: the image pixels are grouped by similarity and the classes are identified afterwards.
Supervised classification often yields better results, but it needs reference data which are difficult or costly to obtain (field campaigns, photo-interpretation, etc.).
What time series bring
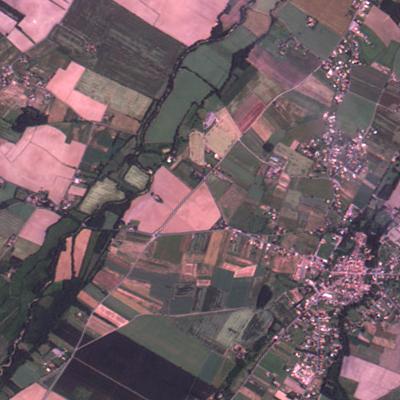
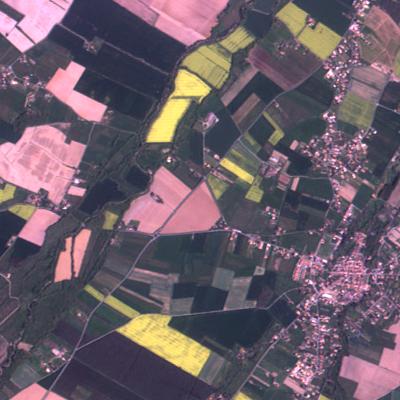
Until recently, fine scale land cover maps have been nearly exclusively produced using a small number of acquisition dates due to the fact that dense image time series were not available. The focus was therefore on the use of spectral richness in order to distinguish the different land cover classes. However, this approach is not able to differentiate classes which may have a similar spectral signature at the acquisition time, but that would have a different spectral behaviour at another point in time (bare soils which will become different crops, for instance). In order to overcome this problem, several acquisition dates can be used, but this needs a specific date selection depending on the map nomenclature. For instance, in the left image, which is acquired in May, it is very difficult to tell where the rapeseed fields are since they are very similar to the wheat ones. On the right image, acquired in April, blooming rapeseed fields are very easy to spot.
If one wants to build generic (independent from the geographic sites and therefore also from the target nomenclatures) and operational systems, regular and frequent image acquisitions have to be ensured. This will soon be made possible by the Sentinel-2 mission, and it is right now already the case with demonstration data provided by Formosat-2 and SPOT4 (Take 5). Furthermore, it can be shown that having a high temporal resolution is more interesting than having a high spectral diversity. For instance, the following figure shows the classification performance results (in terms of \( \kappa \) index, the higher the better) as a function of the number of images used. Formosat-2 images (4 spectral bands) and simulated Sentinel-2 (13 bands) and Venµs (12 bands) data have been used. It can be seen that, once enough acquisitions are available, the spectral richness is caught up by a fine description of the temporal evolution.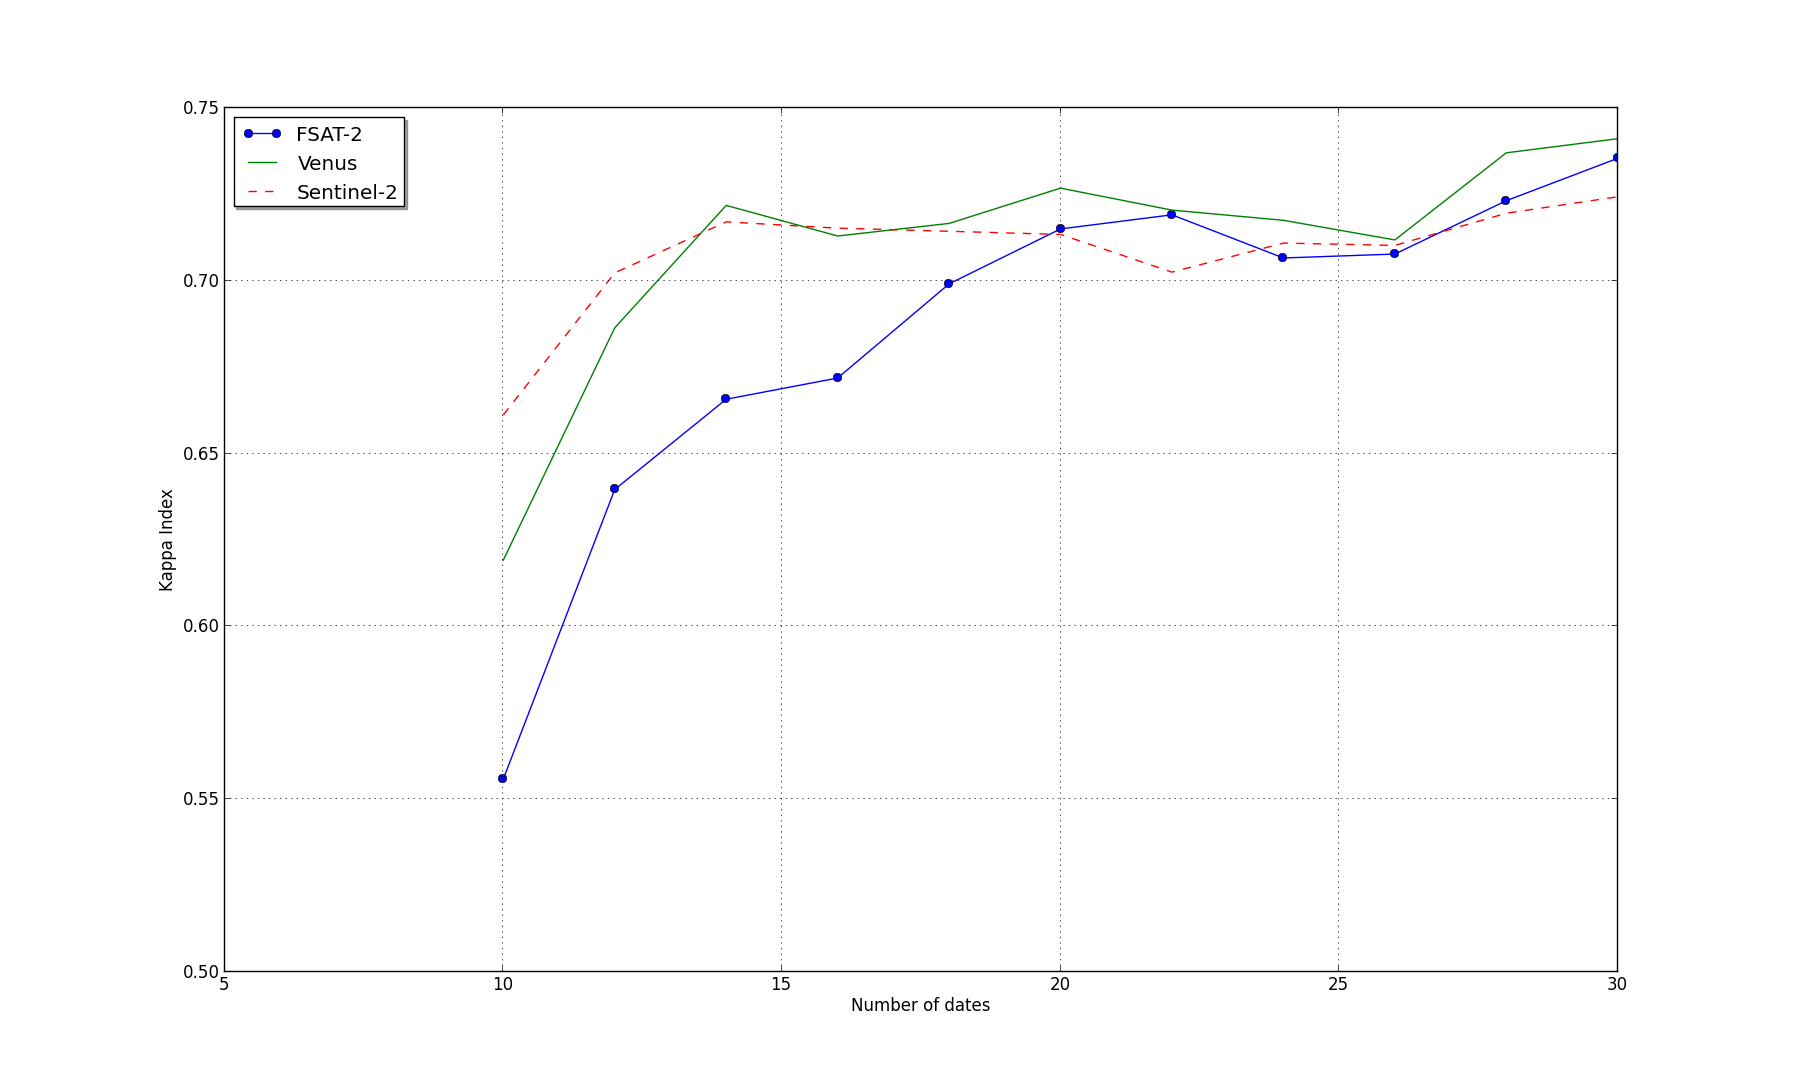
What we can expect from Sentinel-2
Sentinel-2 has unique capabilities in the Earth observation systems landscape:
- 290 km. swath;
- 10 to 60 m. spatial resolution depending on the bands;
- 5-day revisit cycle with 2 satellites;
- 13 spectral bands.
Systems with similar spatial resolution (SPOT or Landsat) have longer revisit periods and fewer and larger spectral bands. Systems with similar temporal revisit have either a lower spatial resolution (MODIS) or narrower swaths (Formosat-2). The kind of data provided by Sentinel-2 allows to foresee the development of land cover map production systems which should be able to update the information monthly at a global scale. The temporal dimension will allow to distinguish classes whose spectral signatures are very similar during long periods of the year. The increased spatial resolution will make possible to work with smaller minimum mapping units. However, the operational implementation of such systems will require a particular attention to the validation procedures of the produced maps and also to the huge data volumes. Indeed, the land cover maps will have to be validated at the regional or even at the global scale. Also, since the reference data (i.e. ground truth) will be only available in limited amounts, supervised methods will have to be avoided as much as possible. One possibility consists of integrating prior knowledge (about the physics of the observed processes, or via expert rules) into the processing chains. Last but not least, even if the acquisition capabilities of these new systems will be increased, there will always be temporal and spatial data holes (clouds, for instance). Processing chains will have to be robust to this kind of artefacts.
Ongoing work at CESBIO

In his PhD work, Antoine works on methods allowing to select the best dates in order to perform a classification. At the same time, Isabel Rodes is looking into techniques enabling the use of all available acquisitions over very large areas by dealing with both missing data (clouds, shadows) and the fact that all pixels are not acquired at the same dates. These 2 approaches are complementary: one allows to target very detailed nomenclatures, but needs some human intervention, and the other is fully automatic, but less ambitious in terms of nomenclature. A third approach is being investigated at CESBIO in the PhD work of Julien Osman: the use of prior knowledge both quantitative (from historical records) and qualitative (expert knowledge) in order to guide the automatic classification systems. We will give you more detailed information about all those approaches in coming posts on this blog.