How do we use Remote Sensing data at CESBIO ?
Several data access centres are being renovated at CNES, ESA, and their first versions often lack some of the features we need. Together with colleagues from CESBIO, we have made a presentation of the way we use remote sensing (RS) data: here is a text version of this presentation.
Of course, there are as many ways of using the data as there are users, but we can find some recurring patterns in all CESBIO users. What about you ? How do you use RS data? Please specify that in the article’s comments. There are certainly other modes of use than ours, just as effective.
What users are we ?
At CESBIO, or among the laboratories we work with, we have different types of users:
- Scientists with high skills in computer science, capable of developing their applications and managing the scaling-up of these processors over large territories
- Non-coding specialist scientists, but able to write scripts, who are interested only in one or more AOIs, possibly over several years and with multiple sensors, who need help with scaling up.
- Scientists who are uncomfortable with coding, or who no longer have the time (did you recognize me?), and who prefer already coded tools.
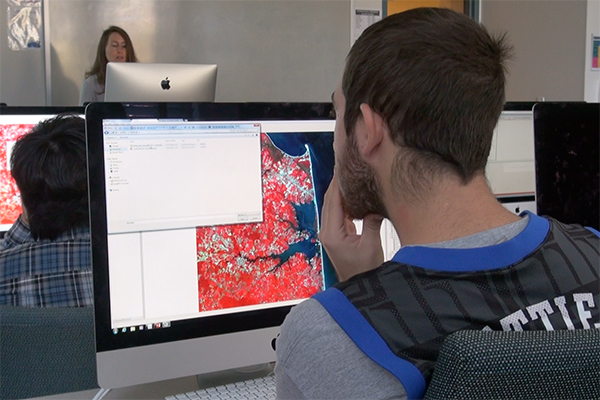
Finally, in general, we rarely work as on the first illustration of the post, and some of us take pride at never looking at the images (but I know they are lying).
Which data ?
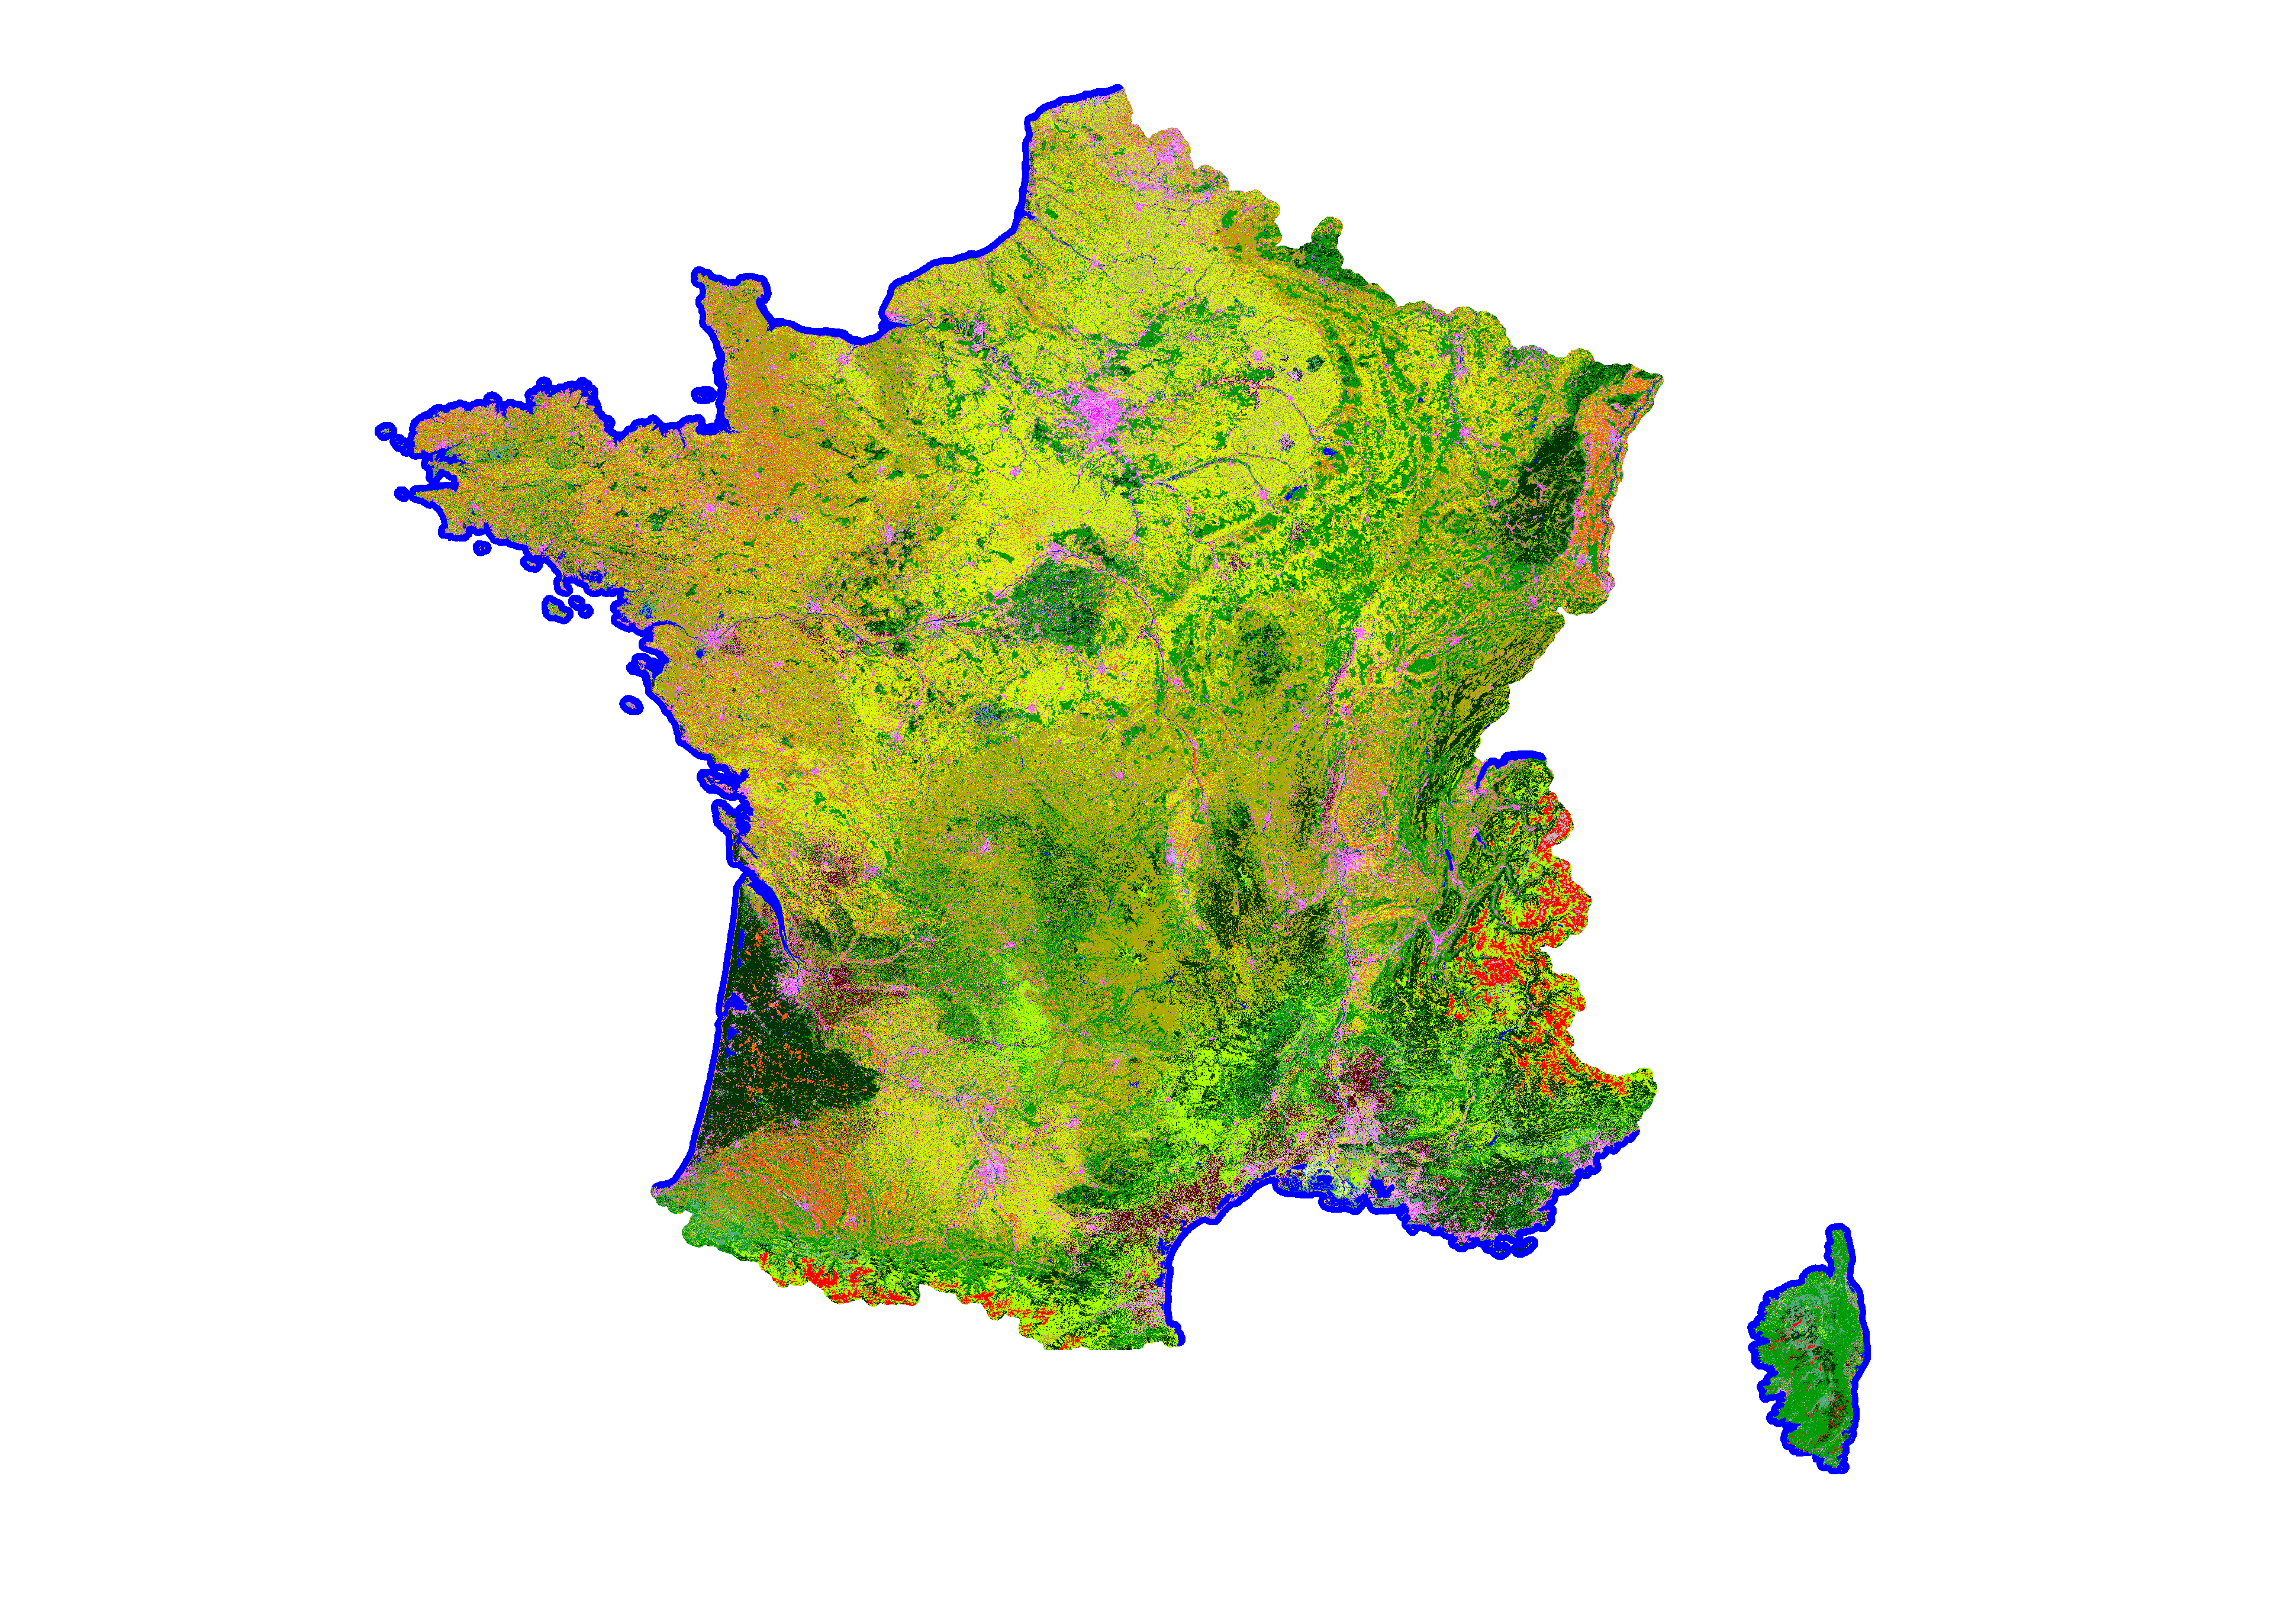
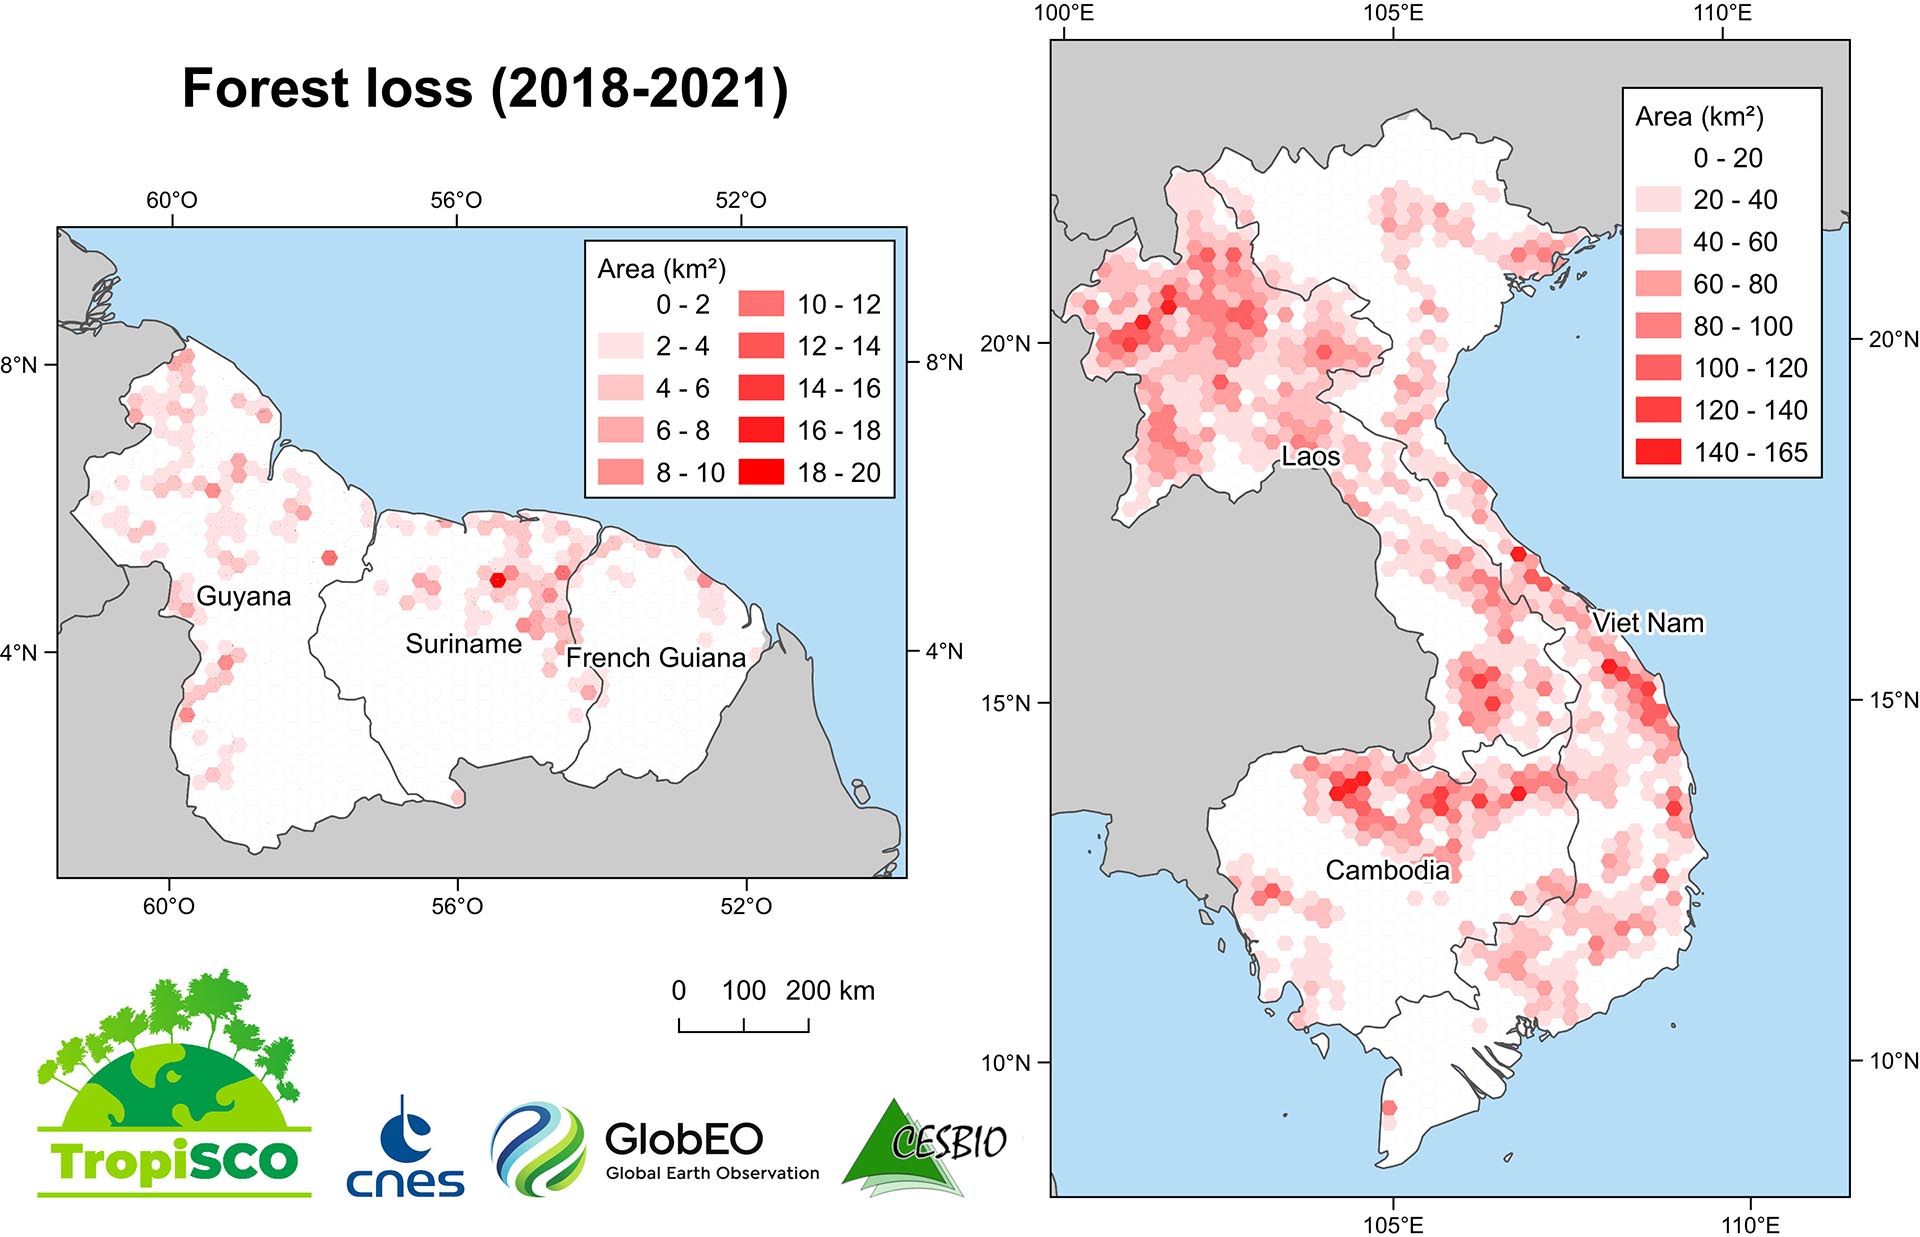
At CESBIO, we are observing vegetation using satellites, and we need a high enough resolution to access the agricultural plots, but we are also interested in large territories and their evolution. The Copernicus data fit our needs, in particular Sentinel-1 and -2, and later Trishna, LSTM, ROSE-L or CHIME will be very useful to us. These are global data, with a strong revisit and a good resolution. They volume is huge, and often distributed by granules covering fairly small territories.
Some of us also use lower resolution global observations, such as SMOS, VIIRS, Sentinel-3, Grace, and if in general resolution is lower, the revisit frequency increases, and the volume remains high.
We also need auxiliary data, such as weather data (analysis, forecasts, atmospheric components), field and validation data…
How do we use them ?
- The data we use often have a global coverage and frequent revisits. We almost never use a single image, we deal with large regions, and often whole years.
- As researchers, we experiment, modify and improve our processors, which never work at first. We develop our own processing tools, so the data is processed many times until we are satisfied with the results
- We sometimes develop interesting processors (yes, we do), and in this case we need to test their scalability to process slightly larger geographical areas..
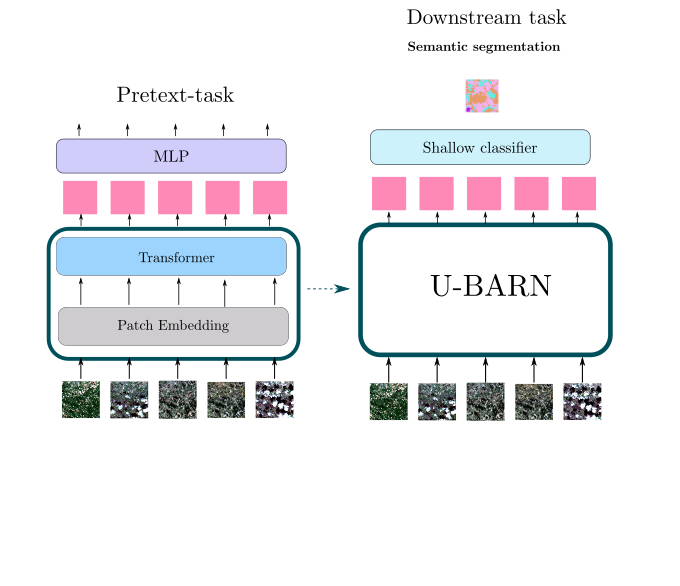
- Machine learning methods often require the use of randomly distributed patches in different landscapes. In the learning phase, we do not need to use whole images.
Data download
It’s true that the trend is to process data close to the source, on remote servers (the Cloud), but downloading is still often necessary, for example when computing resources close to the data are limited or expensive.
Given the quantities of data we use, it is absolutely impossible to download our data by clicking on each of them. We therefore make very little use of interactive data search interfaces, which are mainly useful for data discovery. Some distribution centers provide APIs (Rest, STAC), suitable for some users, but they require to spend time understanding these tools, coding and maintaining them, as the interfaces change. Providing validated, command-line download tools is therefore very necessary, and often overlooked by data providers. For example, we have provided download tools (Peps_download, Theia_download, Sentinel_download, Landsat_download) for several servers, but we had largely underestimated the burden of documentation, maintenance and answering questions, since these tools have been successful. In our opinion, it’s up to the distribution centers to provide them, not up to the users.
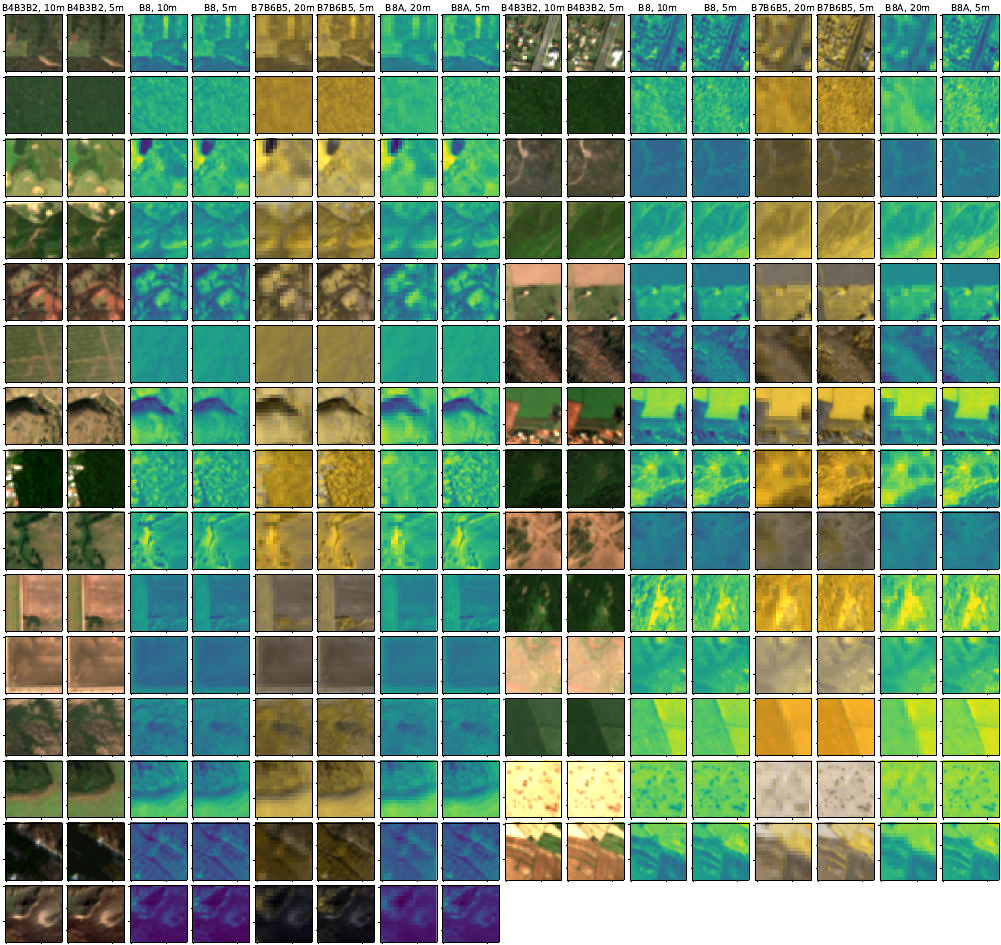
Automatic learning is often based on small patches randomly selected from the products. To save transfer time, it would therefore be useful for download tools to be able to select the area of interest, dates and spectral bands. For this, storing data in a web-optimized format, such as Cloud Optimized Geotiff (COG), would be very useful.
Some of us need to cross-reference databases, for example to track simultaneous acquisitions between different satellites, often on different servers, taking into account cloud cover or camera angles, for example. An API opening up access to this information when querying the database is therefore very useful, with as few limitations as possible in terms of performance and number of accesses.
On demand processing
In the same way as for downloads, some sites offer on-demand processing. For example, launch an atmospheric correction or a super-resolution tool. Again, if we use them, it won’t be to run them on a single image, but to process large quantities of data. We therefore need to access this processing from the command line or by having a python API accessible on the server where the data is located.
Cloud computing
Processing data on the cloud saves download time, as the output of processing is often smaller than the input (for example, a land cover map produced from a year’s worth of Sentinel-2 data). However, this presents a number of difficulties, and we’d like to see the task made easier.
From one cloud to another, the tools for automating processing, opening virtual machines and launching processes may differ. If the data we need is on different clouds, or if we want to be able to move our processing from one cloud to another, we need to learn the API protocols specific to these clouds, and adapt them from one cloud to another. This is not efficient.
Our work almost always begins with the creation of data cubes, whose dimensions are spatial coordinates, time, spectral bands or any other useful information. The current format of Sentinel-2 data, for example, is a data cube, with a granularity by dates. However, it may be practical to make data cubes larger or smaller than the 100 x 100 km² data tiles. The use of an API that generates these data cubes on the fly, and allows you to apply processing to them, is therefore very interesting. This is the case with the OpenEO library. It’s not the only API of its kind, but it’s well done and has the good taste of being free software.
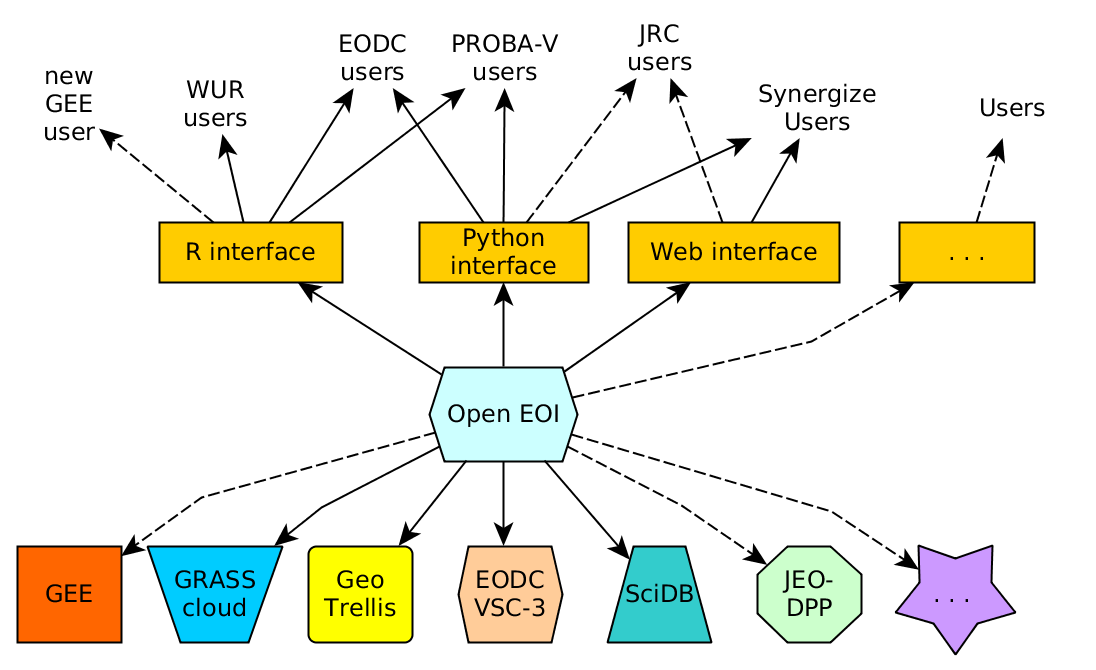
To be able to use data distributed across several cloud servers, OpenEO library needs to be installed on the server side of these clouds. This is how OpenEO came up with the notion of data federation. Datacubes can be generated in parallel on several clouds, with each cloud preparing the part of the datacube for which it owns the data. Participating in this federation therefore also gives visibility to the data available on each cloud.
We kindly urged CNES to install it, and CNES has added it to the GEODES road map and started a « proof of concept » study :).
Help… Help…
Finding information on all these solutions requires a great deal of researches, but should not be the main focus of researchers. What we really need is information, tutorials (but please not video tutorials, which take so much time to find the information you need) and announcements to anticipate changes and improvements. All this is costly and not always included in priorities.
Conclusions
Our colleagues who are developing the Geodes server at CNES seem to have understood our needs, and are preparing a data catalog, data server, a Virtual Research Environment, an information site, python download scripts and are working hard to implement Open EO on our cluster (which requires solving some technical issues apparently). Of course, it takes time, but we should get a lot of improvements compared to PEPS.
The Copernicus dataspace is a bit ahead of us in using all these technologies, but to my knowledge, a good download tool is still missing.
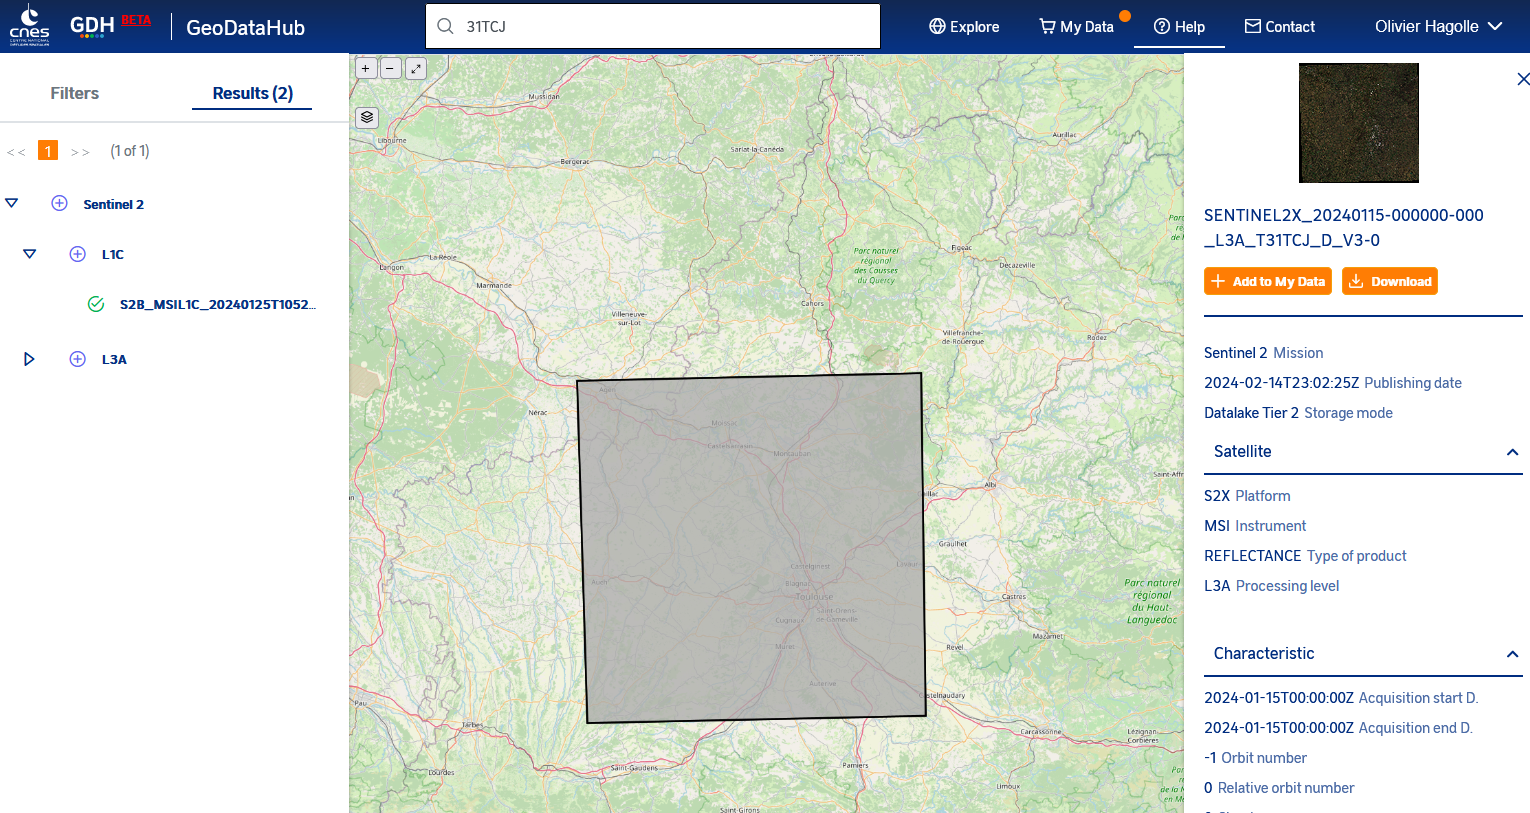
Beta version of Geodes interface and information portal, which will be available in a few weeks.
Thanks !
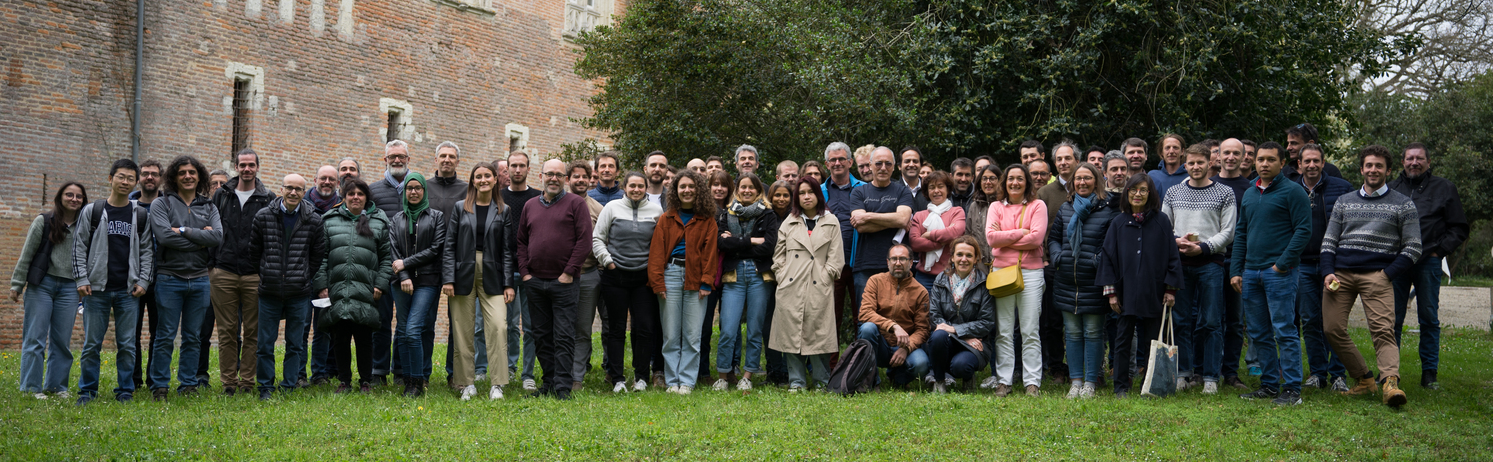
This post is the result of many discussions with my colleagues, with precious inputs provided by Sylvain Ferrant, Julien Michel Emmanuelle Sarrazin and Jordi Inglada at CESBIO.