
China’s NO2 emissions now rising

NO2 emissions are rising again over China, showing the slow recovery of Chinese industry after a two-month shutdown. The graph below was obtained from Sentinel-5p data using the NO2 time series Google Earth Engine app.
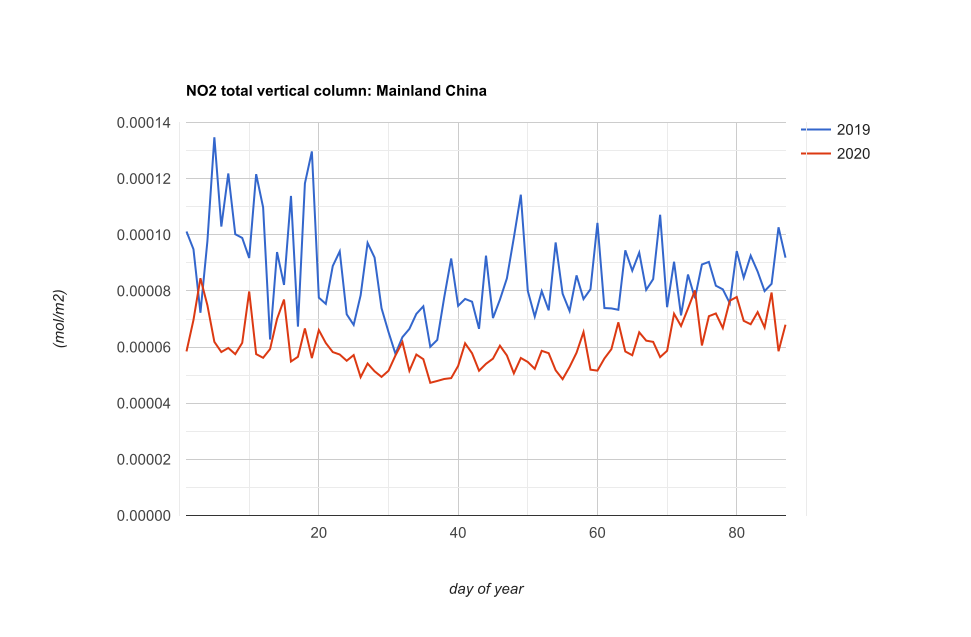
Total vertical column of NO2 (ratio of the slant column density of NO2 and the total air mass factor) from 01 January to 27 March. Daily average over Mainland China. Data source: Copernicus Sentinel-5P NRTI NO2: Near Real-Time Nitrogen Dioxide.

Plus d'actualités

How long is the cooling effect of a cloud shadow ?

How long does it take for the cannon barrel to cool down after firing a shell ? Fernand Raynaud => This quote is from a famous old French funny sketch by Fernand Raynaud, which was based on a question in a French manual for soldiers: the sketch is rather long, so I’ll give you the […]

Impact of the August 12, 2026 eclipse on photovoltaic electricity generation in Spain

Photovoltaic (PV) energy supplies more 20% of Spain’s total electricity, and this share hit a new high in July 2026 (28.3% of the nation’s monthly electricity mix). Some media outlets were concerned about the drop in photovoltaic power generation during the 12-Aug-2026 eclipse. Le Monde explained that « the drop is expected to be particularly pronounced […]

The missing link to valorize CESBIO’s applicative research works

=>  My colleagues at CESBIO are extremely creative! Over the past ten years, they have developed a wide range of new products and methods for extracting information from Copernicus data. They don’t just develop and validate the method on a few sites; they continue their work until they have produced data for the whole of […]

Rechercher
