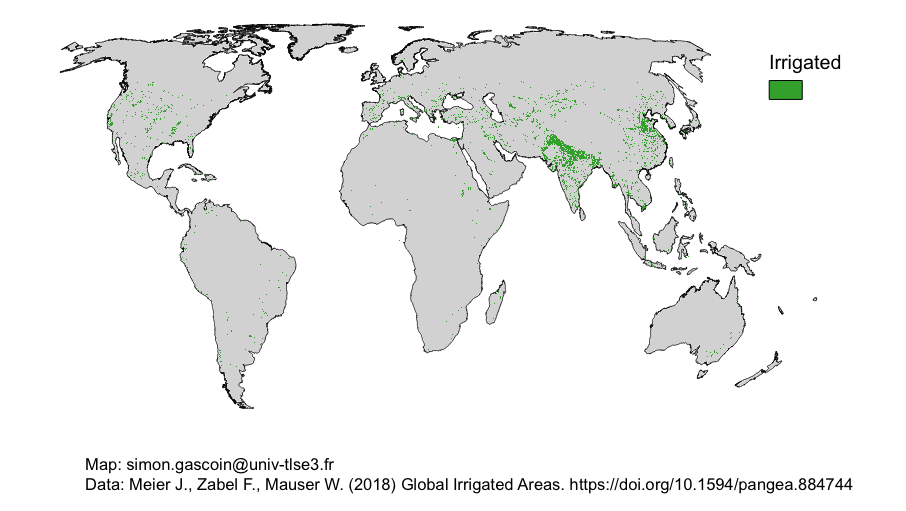
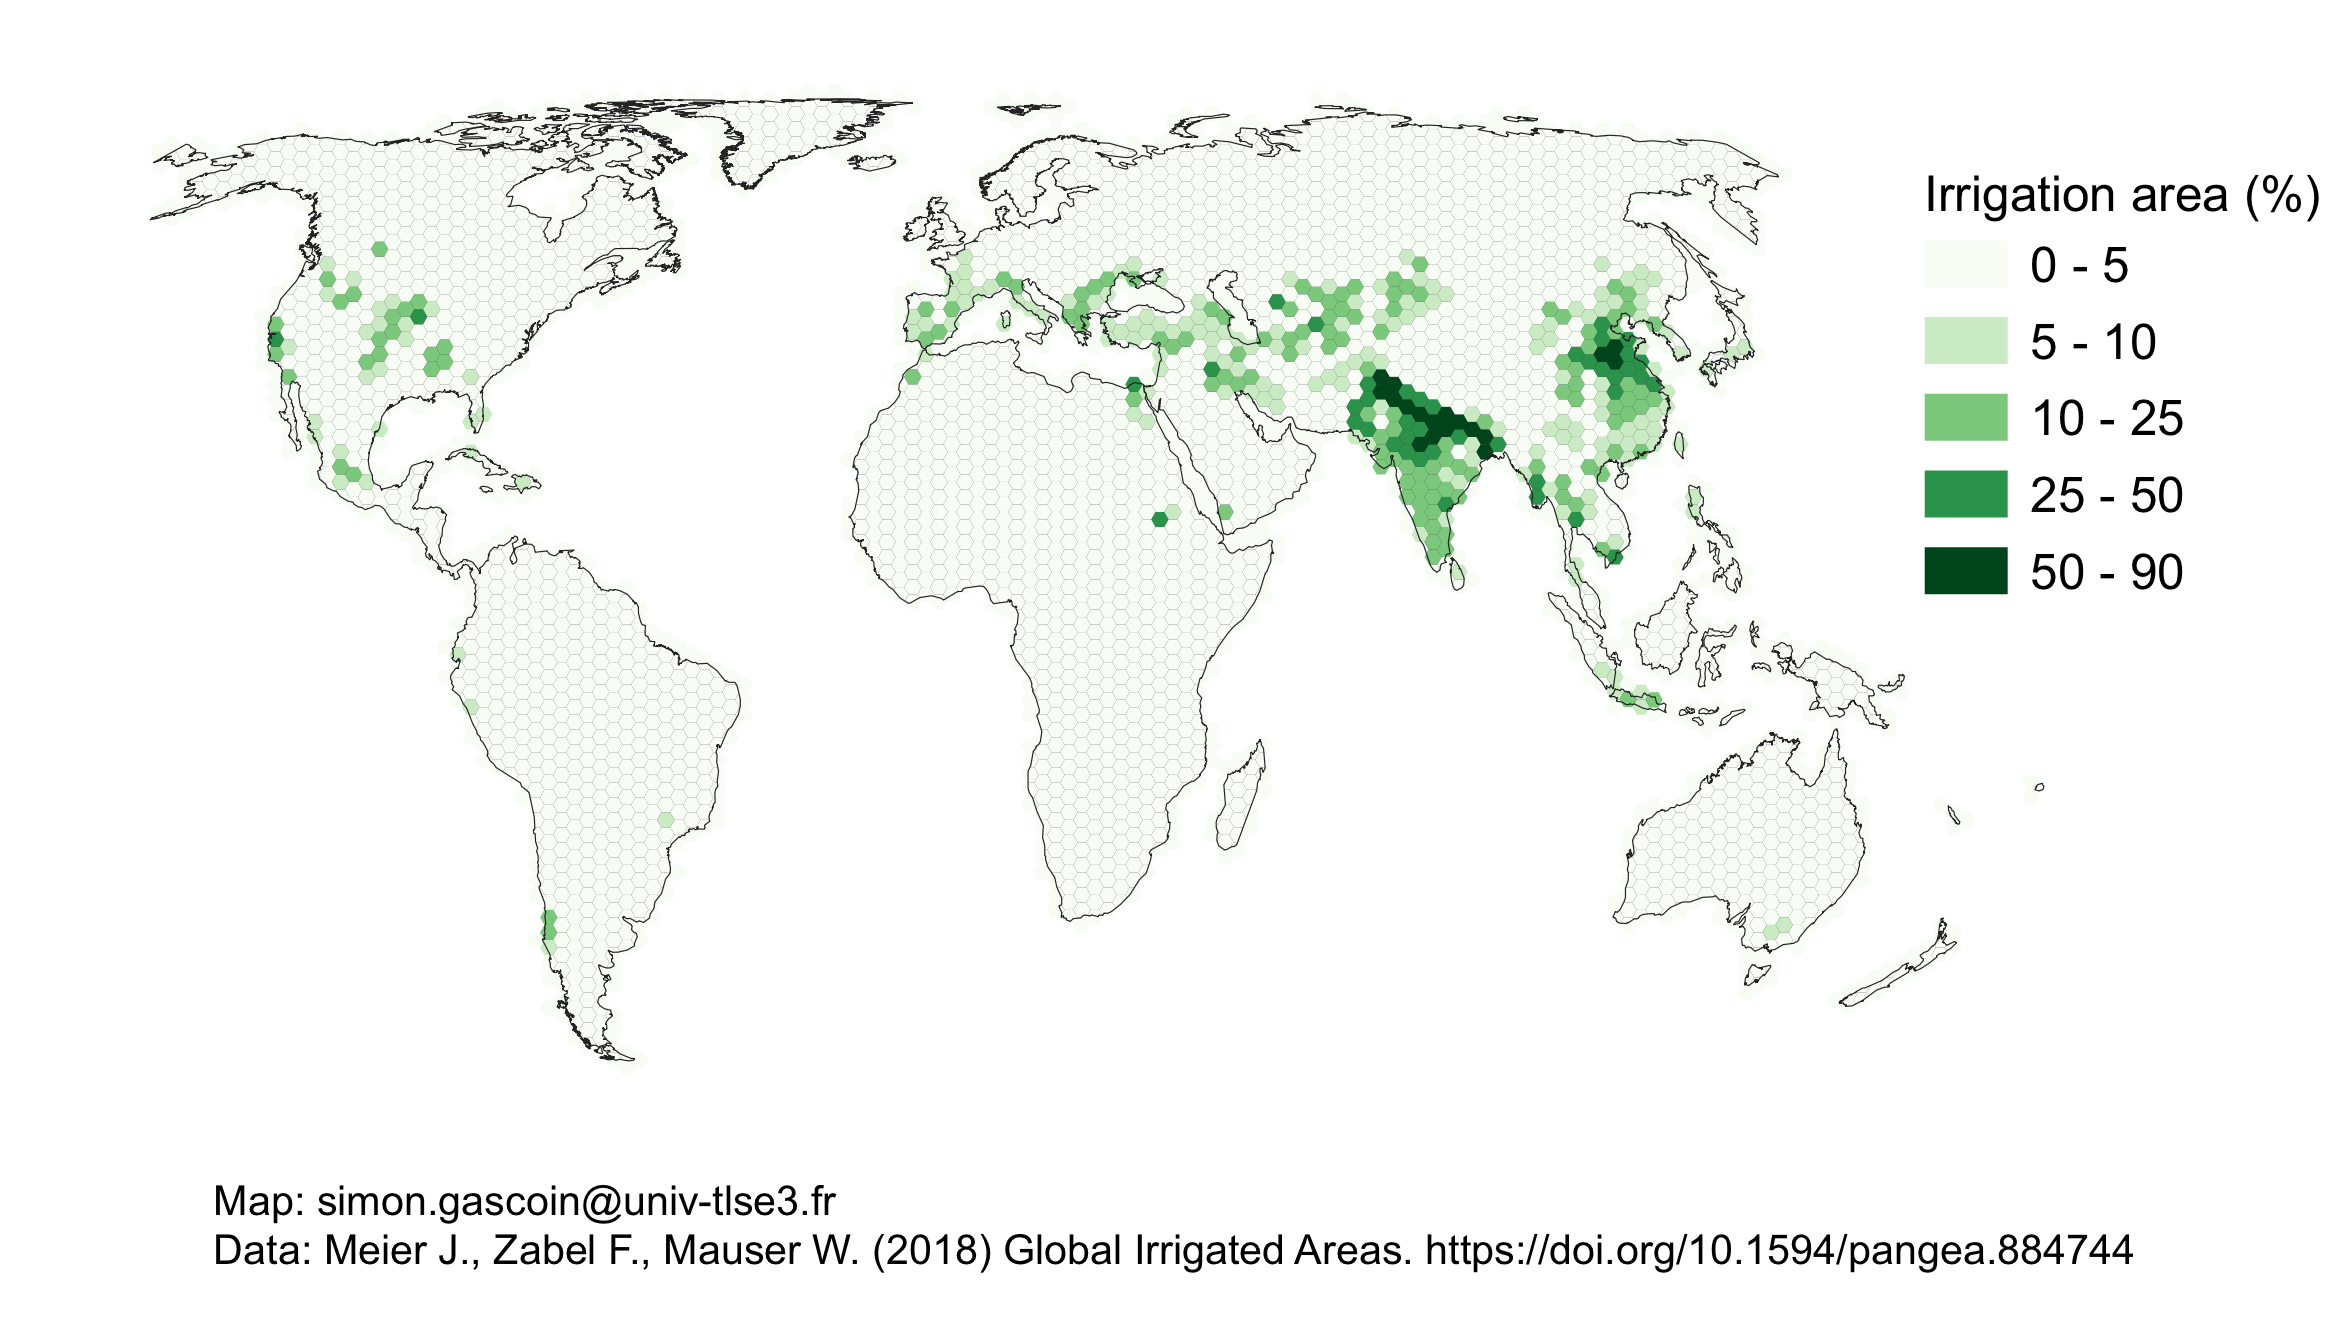
Global map of irrigated areas
It’s not easy to find a good cartographic representation of the global irrigated land, therefore I made my own map using data from Meier et al. (2018).
The raw resolution of the above product is 30 arcsec, i.e. 1 pixel covers about 1 km by 1 km at equator. Here, I aim to represent the entire world in a single picture of say 1000 pixels wide, which means that 1 pixel would span about 40 km of land at the equator. Therefore I need to aggregate the original data to a lower resolution. Many people don’t realize that cartographic software like QGIS or ArcGIS will do this resampling under the hood with a default anti-aliasing method that may not work well with the data to represent, as shown below:
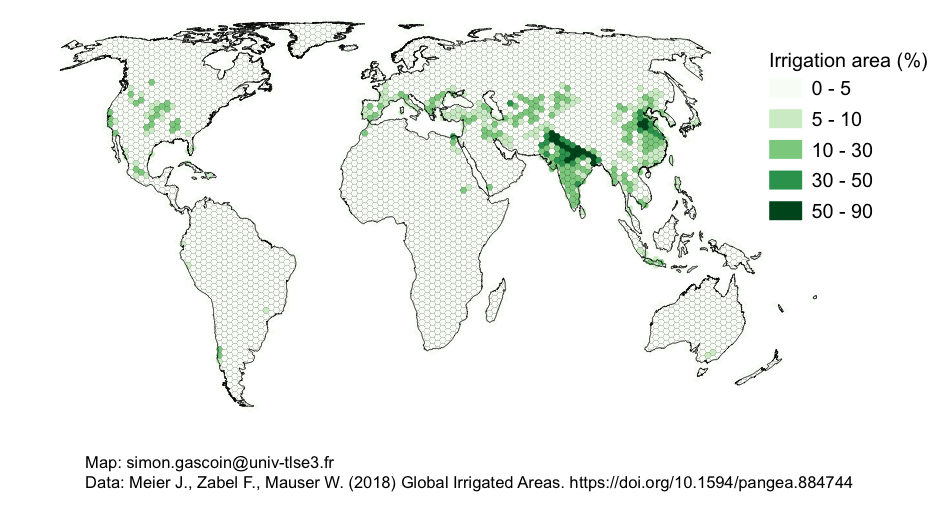
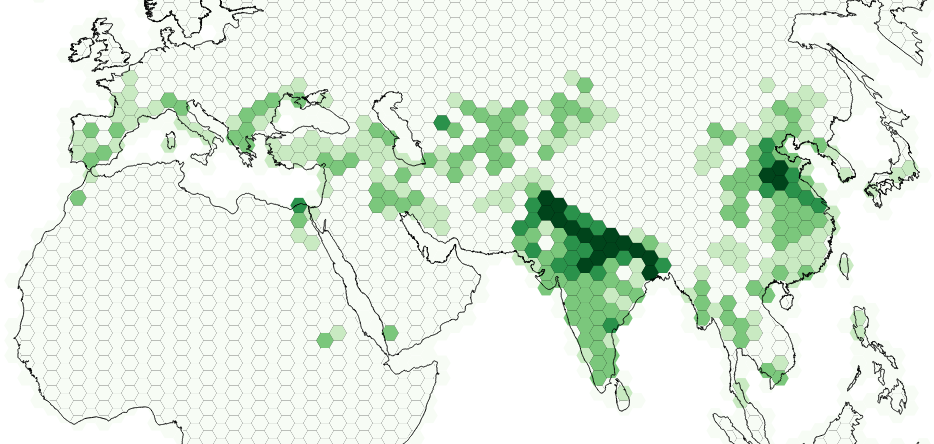
I like to aggregate data with hexagon grids because hexagons are the most circular-shaped polygon that can tessellate to form an evenly spaced grid. Thanks to the MMQGIS plugin it’s easy to generate a shapefile of continuous hexagons covering the Meier et al. layer. Here I worked in the Equal Earth projection because it retains the relative size of areas. Hence I first resampled the Meier et al. layer to Equal Earth at 800 m resolution using the nearest neighbor method. Then, I used the zonal statistics tool in QGIS to compute the « count » of irrigated pixels in every hexagon. Finally I computed the percentage of irrigated area by hexagon using the $area function in the field calculator available from the attribute table menu (percent irrigated = 100*800*800* « _count » / $area).
Using the same method we can aggregate the data by country.
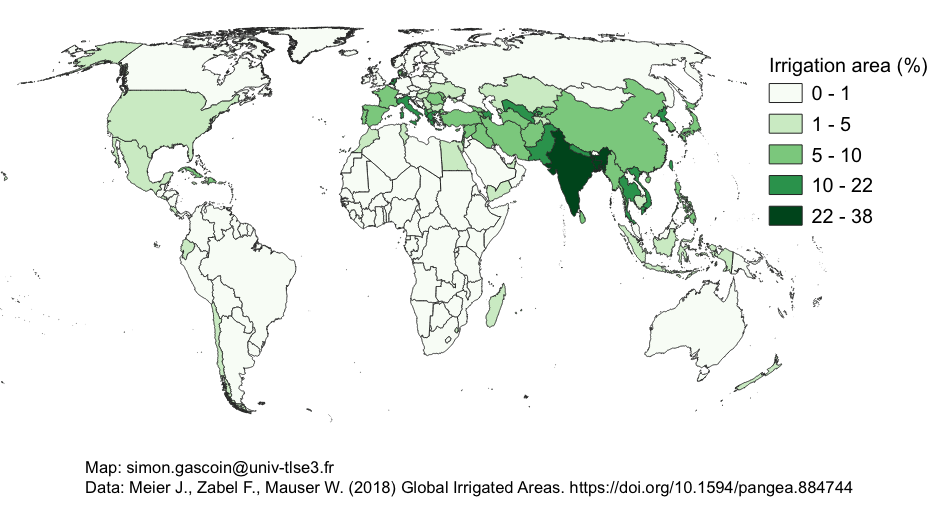
Countries with the highest percentage of irrigated land:
- Bangladesh (38%)
- India (28%)
- Pakistan (22%)
Countries with the largest irrigated area:
- India (876’000 km²)
- China (746’000 km²)
- USA (287’000 km²)
Reference: Meier, J., Zabel, F., and Mauser, W.: A global approach to estimate irrigated areas – a comparison between different data and statistics, Hydrol. Earth Syst. Sci., 22, 1119–1133, https://doi.org/10.5194/hess-22-1119-2018, 2018.