First Sentinel-2 snow map
In the framework of the THEIA land data center, we have developed a simple but robust method to map the snow cover from Sentinel-2-like level 2A products. This code was tested with SPOT-4 Take-5 and Landsat-8 series, but it remained to adapt it so that it can run on real Sentinel-2 images! This is now done thanks to Manuel Grizonnet, which allowed us to process the Sentinel-2A image acquired on 06-July-2015 in the Pyrenees as a first example. This image was produced at level 2A by Olivier Hagolle using the MACCS processor. The snow mask from Sentinel-2 images is calculated at 20 m resolution after resampling the green and red bands that are originally at 10 m resolution while the NIR band is at 20 m.
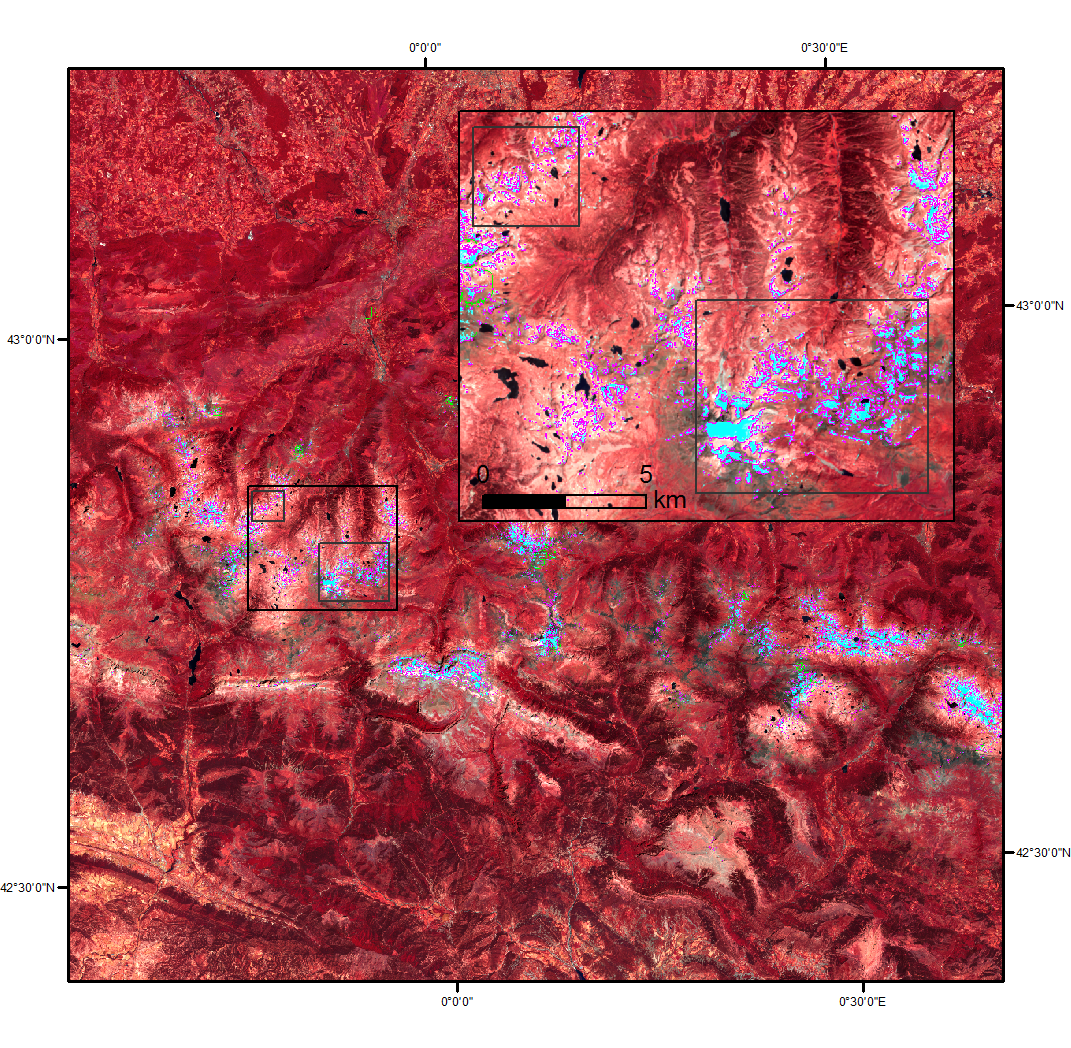
How to make sure everything went well? We can control the snow mask by superposing the mask boundaries on a false color composite:
To go further we would like to compare the snow mask over a fairly large area with an independent source of data. But we have no higher resolution image on that day! Fortunately Mother Nature does things well since the snow patterns at the end of the melt season tend to reproduce from one year to the other (this concept was developed by famous snow scientist Matthew Sturm). So we can try to superimpose our snow mask with an orthophoto of the French Geographic Institute as airborne campaigns are generally conducted in summer (to avoid the presence of snow…).
These animations below show the comparison of our snow mask with an orthophoto dated 2013 in the Vignemale and Gavarnie area.
I could not find the exact date of this orthophoto, but we know it dates from the summer of 2013. Thanks to the persistence of snow patterns from one year to another can see that it seems to work rather well!