
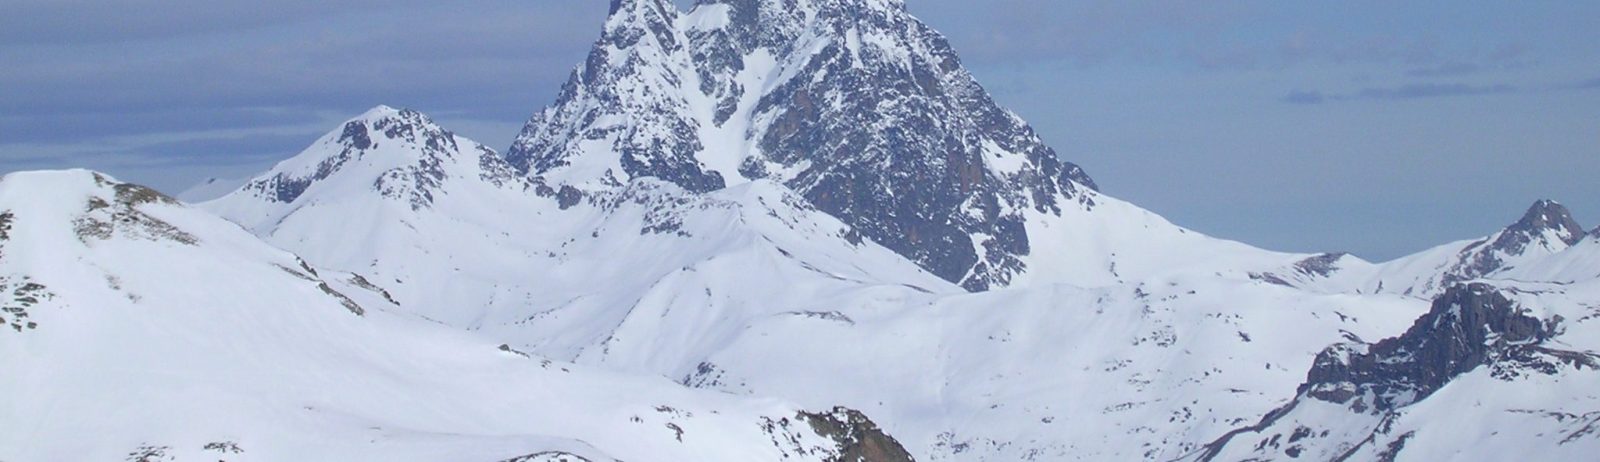
Evolution of the snow cover area in the Pyrenees from MODIS
The Cesbio contributes to the Pyrenees Climate Change Observatory (OPCC) through the analysis of the snow cover evolution using satellite imagery. We are working on three remote sensing techniques in the framework of the CLIM’PY project:
- MODIS snow cover area (500 m, daily)
- Sentinel-2 snow cover area (20 m, 5-day revisit)
- Pléiades snow depth (2 m, once per year, only a 20 km x 20 km region)
Although the observation of the snow cover by satellite began in the 1960’s, it is still difficult to use remote sensing data for climate change studies at the scale of the Pyrenees. The Landsat record dates back to 1980’s and can be used to map the snow cover area (see this example in the Canigou mountain), but the frequency of acquisition—about one clear-sky image per month—is too low with respect to the natural variability of the snow cover. On the other hand, MODIS allows mapping the snow cover area at the daily time step since 2000. The daily revisit is important to track the variations of the snow cover and also to make cloud-free composites like the time series of monthly snow cover maps shown below:

You can check the snow cover in near real time in our Pyrenees Snow Monitor!
Alas, 17 years of continuous observations are still insufficient in comparison to the standard of 30 years used in climatology. However, these data are useful to evaluate and improve numerical models of the snow cover. This figure below shows the comparison between the snow cover area determined from MODIS and simulated by SURFEX land surface model. Both datasets agree very well, which gives us confidence that the model is working well, at least under the climatic conditions of the recent years. Such models are key to anticipate the effect of climate change on the snow cover in the Pyrenees, because they can be forced by climate model outputs to make projections of the future snow cover conditions.

References
[1] Gascoin, S. O. Hagolle, M. Huc, L. Jarlan, J.F. Dejoux, C. Szczypta, R. Marti, and R. Sanchez (2015) A snow cover climatology for the Pyrenees from MODIS snow products, Hydrol. Earth Syst. Sci., 19, 2337-2351, doi:10.5194/hess-19-2337-2015.
[2] See the Theia snow product page.
[3] Marti, R., Gascoin, S., Berthier, E., de Pinel, M., Houet, T., and Laffly, D. (2016) Mapping snow depth in open alpine terrain from stereo satellite imagery, The Cryosphere, 10, 1361-1380, doi:10.5194/tc-10-1361-2016.
[4] Martin E., Gascoin S., Grusson Y., Murgue C., Bardeau M., Anctil F., Ferrant S., Lardy R., Le Moigne P., Leenhardt D., Rivalland V., Sánchez Pérez J.M., Sauvage S., Therond O. (2016) On the Use of Hydrological Models and Satellite Data to Study the Water Budget of River Basins Affected by Human Activities: Examples from the Garonne Basin of France. Surveys of Geophysics, 37(2), 223-247, doi:10.1007/s10712-016-9366-2


