Evaluating ERA5 wind direction with Copahue Volcano plume
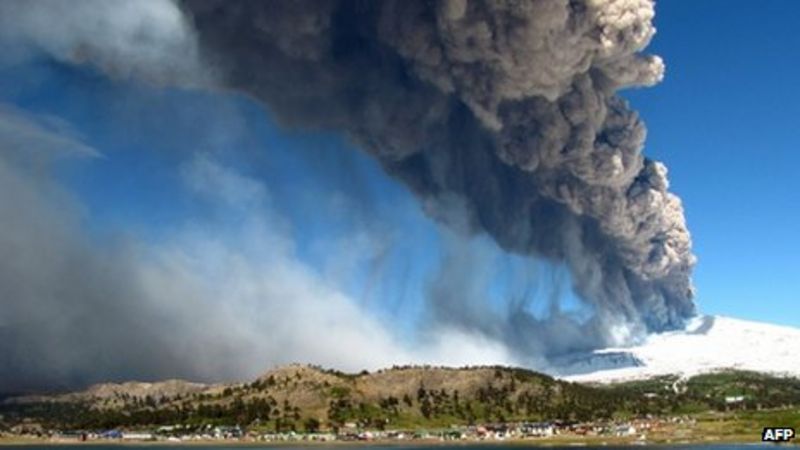
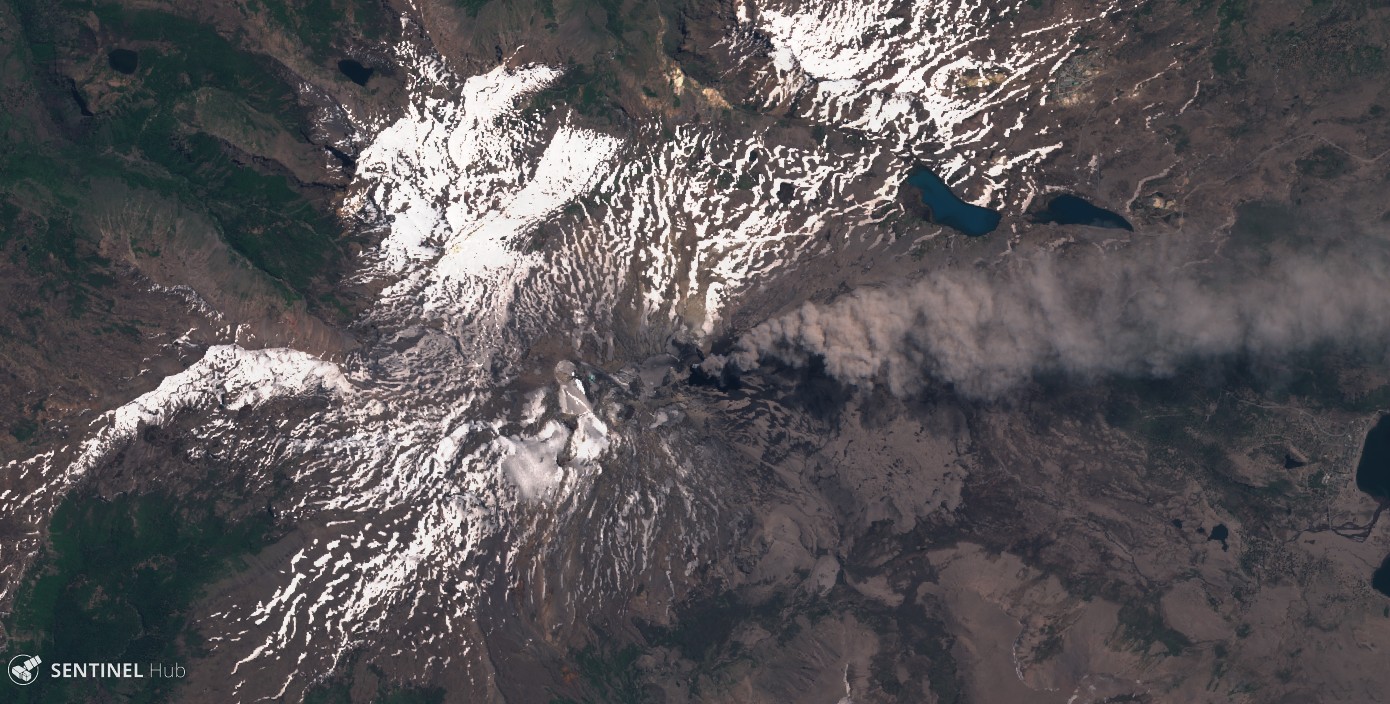
Copahue is an active volcano in the Andes on the Chile-Argentina border. It erupted in 2016 and a plume of smoke was visible in many Sentinel-2 images during that period. Looking at these pictures I thought it would be fun to use that plume as a giant anemometer to evaluate climate model data.
I extracted the wind vector from ECMWF ERA5 climate reanalysis available at the hourly time step in Google Earth Engine. Since Sentinel-2 overpass time is approximately 14h30 UTC in that area, I queried only ERA5 data corresponding to the 14h time step.
// Copahue volcano crater
var pt = ee.Geometry.Point([-71.18,-37.86]);

// filter a year of ERA5 collection at 14:00 UTC
var uv = ee.ImageCollection("ECMWF/ERA5_LAND/HOURLY")
.filterBounds(pt)
.filterDate('2016-01-01','2016-12-31')
.filter(ee.Filter.calendarRange(14, null, 'hour'))
.select(['u_component_of_wind_10m','v_component_of_wind_10m']);

// Plot U,V
print(ui.Chart.image.series(uv,pt));

I downloaded this figure as a table, then extracted the wind vector of a few dates corresponding to cloud-free Sentinel-2 images in 2016.
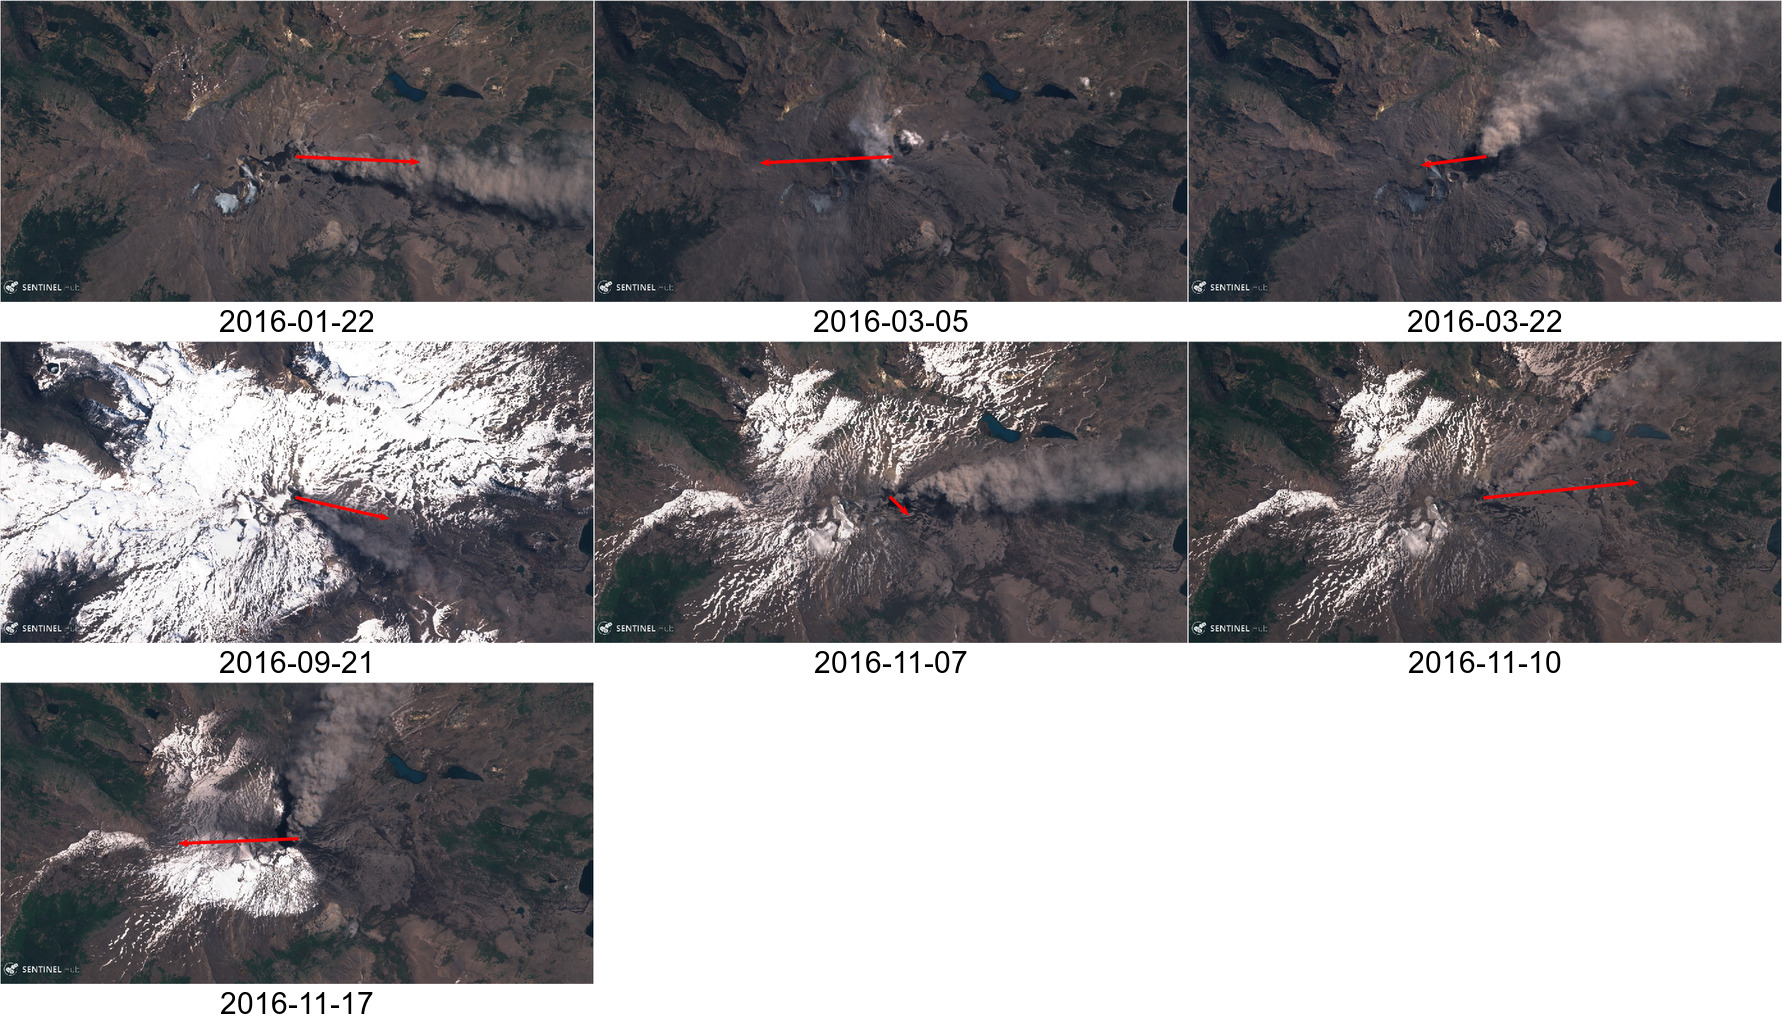
The wind vector matches the plume direction only on 22 Jan and 21 Sep… That is a score of 2/7, ECMWF you can do better!
Note from ECMWF
Care should be taken when comparing this variable with observations, because wind observations vary on small space and time scales and are affected by the local terrain, vegetation and buildings that are represented only on average in the ECMWF Integrated Forecasting System.
[1] a more elegant solution would be to draw the wind arrows in GEE directly but I felt that would led me to catch Mrs-Armitage-on-Wheels Syndrom)