Estimation of evapo-transpiration over a water catchment
Evapotranspiration is a key factor to estimate the water quantities involved in the water cycle. For instance, one extimates that 60% of rain water is evapo-transpirated, and wheat plant releases 500mm of water through evapotraspiration. It is therefore useful to monitor this variable along the agricultural seasons, to estimate the crop water needs and maybe identify the water stress periods and measure their impact.
Plant evapo-transpiration process
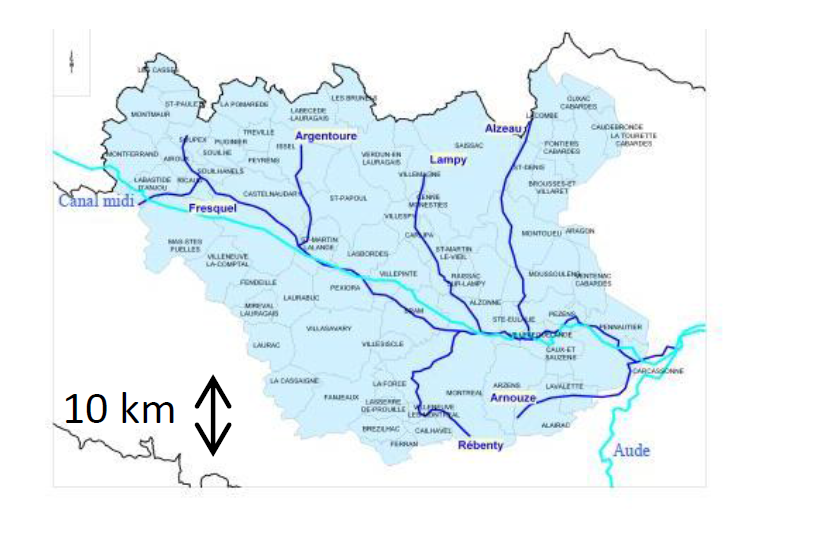
In the framework of the SIRHYUS project, in which CESBIO is deeply involved, a prototype of a processor was developped to estimate evapo-transpiration at the scale of a water catchment. The selected catchment is the Fresquel one, which is a 937 km² catchment, in the South of France, near Carcassonne and its famous medieval fortress. The main crops there are cereals, sunflower, vineyards, and, to a lesser extent, corn and rapeseed.
 Study zone, the Fresquel catchment
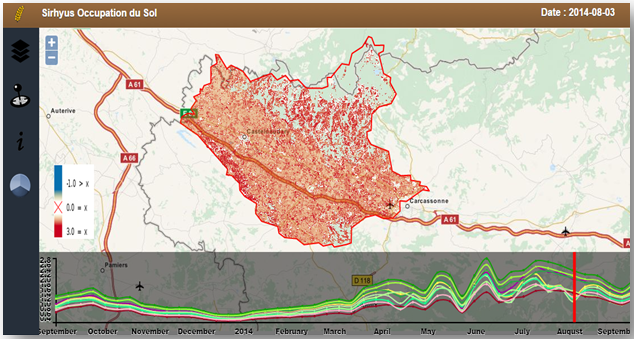
As already explained in the post that describes the Sat-irr model, the FAO-56 (Allen & al. 1998) was used and spatialised. The FAO-56 models the E.T. of any crop type is equal to the reference E.T. (written E.T0), multiplied by an empirical crop factor KC. E.T.0 is itself computed with the de Penman-Monteith equation. The crop coefficient KC depends on the biological features of the plant (height, leaf surface, photosynthesis type…) and of its development stage. The Penman-Monteith relies on weather data (temperature, humidity etc.) which are available through the global weather analyses (NCEP, ECMWF) in quasi real time. Some python scripts were developped to automatise the data download.These algorithms are available here. The Landsat Images provided by the THEIA land data center after atmospheric correction, were used to control the value of the Kc coefficient as a function of the plant phenological cycle : the NDVI, computed from and red and near-infrared bands extracted from the images allows to monitor the growth of the crops. These images are also used to obtain land cover maps, as detailed here, and to associate a crop coefficient to each pixel. It is then possible to obtain evapo-transpiration maps for all the catchment,and to provide them through a website (click on evapo-transpiration). The next figure is a screen copy of this web site : on each pixel of the catchment, it is possible to read the whole year evapo-transpiration profile, sampled every 8 days.
 Screen copy of the evapo-transpiration web page. The bottom plot provides the evapo-transpiration of several crops as a function of time (light green, meadows, red, vineyards, purple, sunflower, and pink, vegetables).
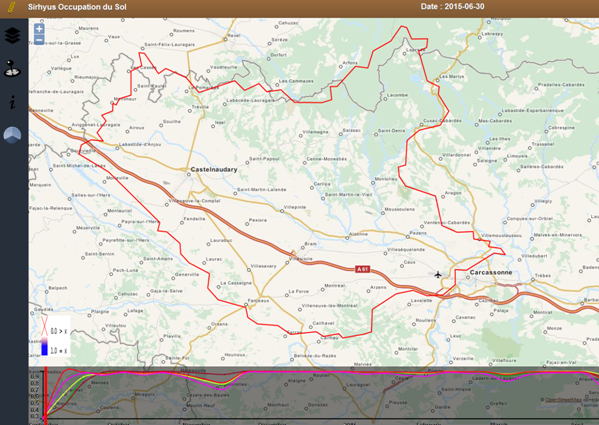
These maps are further processed to obtain soil water content maps on the catchment area.
 The bottom plot provides the soil water content (%) as a function of time..
Several validation campaigns were lead on the CESBIO sites in Lamasquère and Auradé near Toulouse, between 2006 and 2011. The plot below shows a comparison between the terrain measured evapo-transpiration, and the one modelled by our processing, for a corn plot.
 Comparison of terrain ET, in black and ET modelled through remote sensing data (in red) in mm. RMSE is 0.27 mm. Comparison of terrain ET, in black and ET modelled through remote sensing data (in red) in mm. RMSE is 0.27 mm. |
.As the risk of water shortages is becoming more frequent, such a work allows to better understand the water needs at the scale of a catchment, and the knowledge of the ground water content can be used to optimise irrigation and spare some of this precious resource. With the arrival of Sentinel-2, and with its more frequent observations, such a monitoring will be more accurate and reliable.


