[Directional Effects] Validation of DART simulations of vineyards using VENµS multi-angular observations
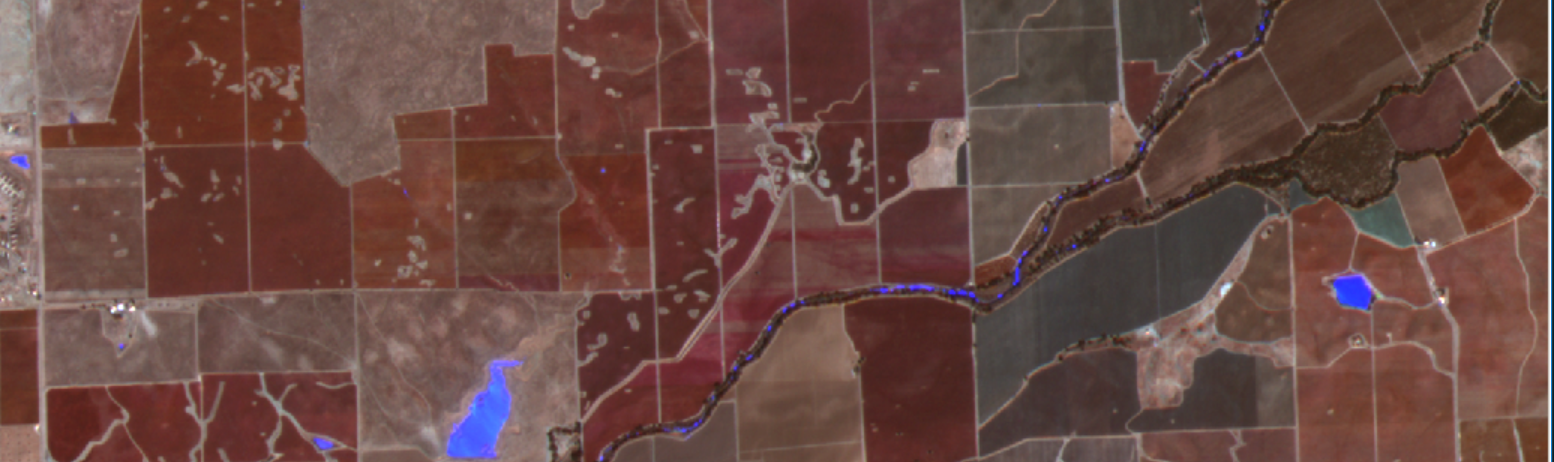
Question: The color image displayed on the left is a new kind of RGB composite image, can you guess how it was made ?
Hints: the blue bright pixels correspond to water, but water is not bright usually… except if it is obtained in specular condition, when the water surface mirrors the sun towards the satellite. But Sunglint is white usually then, so why is it blue and not white ?
Answer: this image is made from 3 images of VENµS acquired during a single orbit, a first one acquired when the satellite is looking forward, then looking down, and then looking backward, and we just displayed the image using the following RGB composite:
(red band backward direction; red band « Nadir » direction; red band forward direction)
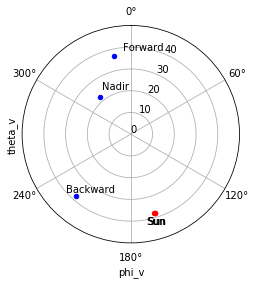
The graph on the right shows a representation of the geometric configuration available for that date: the viewing zenith angle is the radius of the plot, while the azimuth is the direction of the observation, relatively to the North. The position of the sun at the time of overpass is also displayed, in red,using the same conventions. You can see that on that day, the forward observation direction is almost exactly symmetrical to the sun direction, with regard to the vertical direction at the center of the graph. This means that the forward direction is obtained in specular conditions, which explains why the water bodies in the RGB image are so bright and blue.
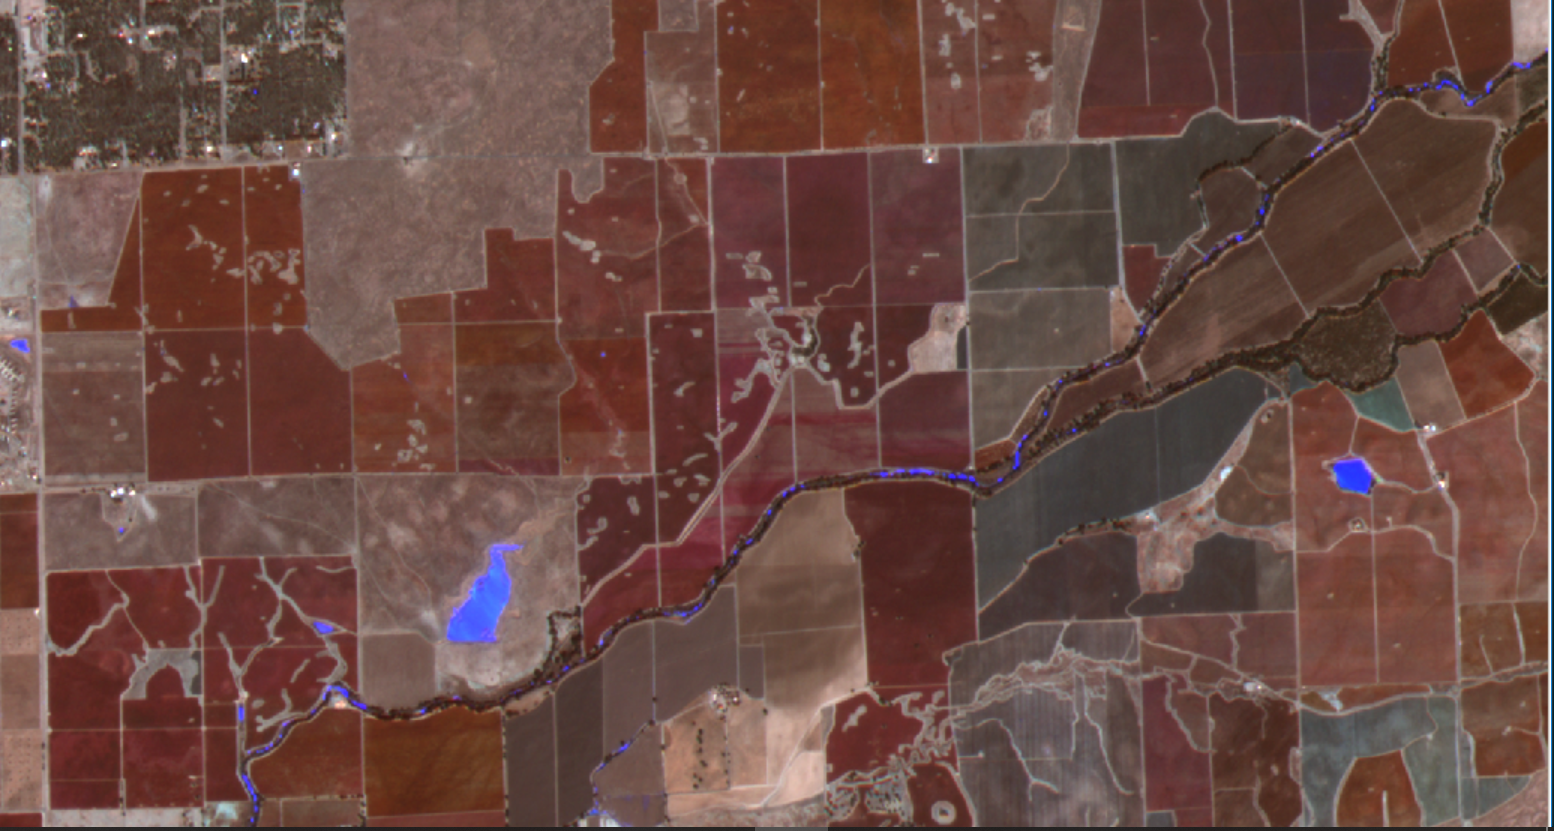
In the RGB directional composite, most of the visible agricultural plots are vineyards, but with a closer look, did you notice that the vineyards appear in two colours, Bordeaux, and Grey.
Question : Any idea of a reason why ?
Guess: Bordeaux : Merlot, Gray : Pinot gris
Answer: Not at all
Well, the real answer is that the colour is due to the orientation of the vineyard rows. In this region of the world, the plot limits are usually oriented East-West and North-South, and so are the rows in the plots. In the image, E-W rows appear with Bordeaux colour, and N-S rows appear gray.
Q : OK, but why ?
A : The red band reflectance is higher for the E-W plots because, due to the rows, the shadows of the plants are invisible, while for the N-S plots, the inter roxs are visible from the backward direction and therefore their shadows are visible.
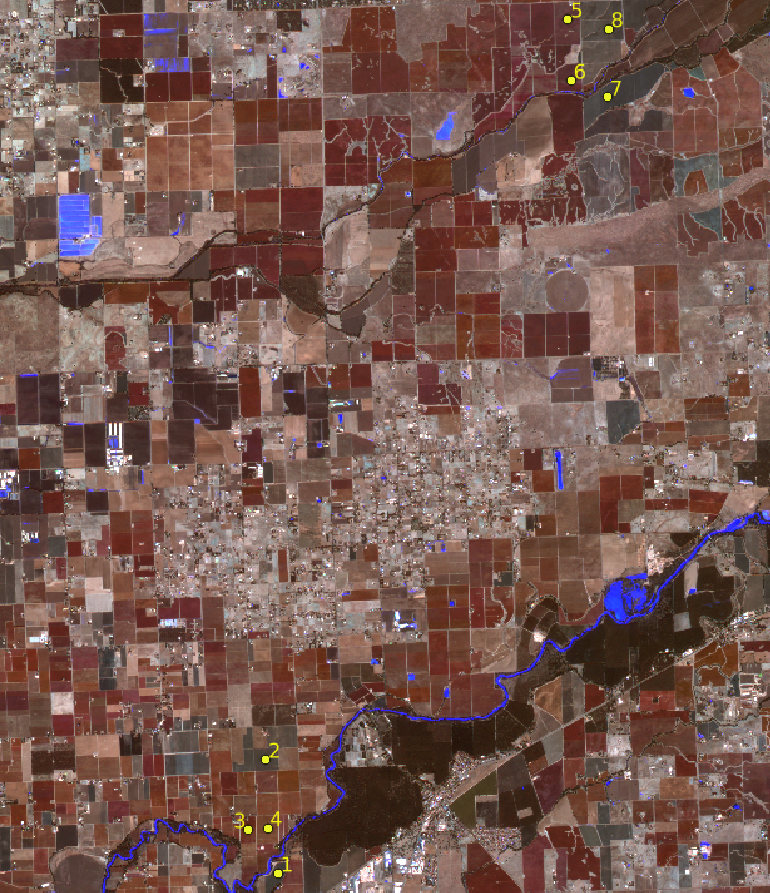
As shown in the graphs below, we tried, and succeeded to simulate that with the DART 3D radiative transfer code developped at CESBIO, and compared with VENµS acquisition. We found out that it matched pretty well with the spectral profiles of 8 different plots (4 E-W in blue plots, and 4 N-S in red plots) that we selected in the images (the ROI numbers are provided in the image above). The match is already quite good, except in the NIR band in the backward direction, but this could be explained by the fact we used we used a 3D model taken from a French vineyard (a good one), and not from a Californian one (no comment 😉 . ). We recently had access to terrain information in a couple of plots, thanks to colleagues from USDA, and will try to improve our simulations by better simulating the architecture of the vineyard.
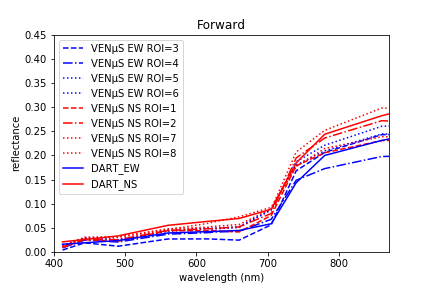 |  | 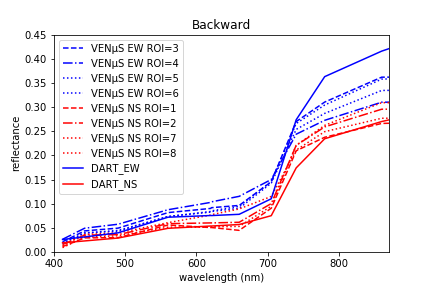 |
Spectra of ROI numbered on the image above, from VENµS images (dashed lines) and radiative ransfer simulations with DART (continuous lines). Click on the plots to enlarge. Despite the variation between plots of the same type, it seems possible to separate both orientation from the reflectance spectra.
As a conclusion, this study, which will be extended to other types of crops in a coming post, shows that there are large variations of surface reflectance depending on the orientation of rows. In this regard, vineyards can be considered as a worst case, with a large interval between rows. However, users who want to estimate biophysical variables on vineyards from surface reflectances or NDVI should be aware of the large impact of orientation on their estimates.
Many thanks to the DART team who did the simulations, especially to Nicolas Lauret !