Combined exploitation of VENμS, Sentinel-2 and Landsat-8: the spectral bands

=>

The combined use of VENμS, Sentinel-2 and Landsat-8 data can increase the likelihood of obtaining cloud-free images or may allow detailed tracking of rapidly evolving phenomena. In order to facilitate this combination, the table below summarizes the correspondences between the spectral bands of the instruments. VENμS does not have a spectral band in the middle infrared.

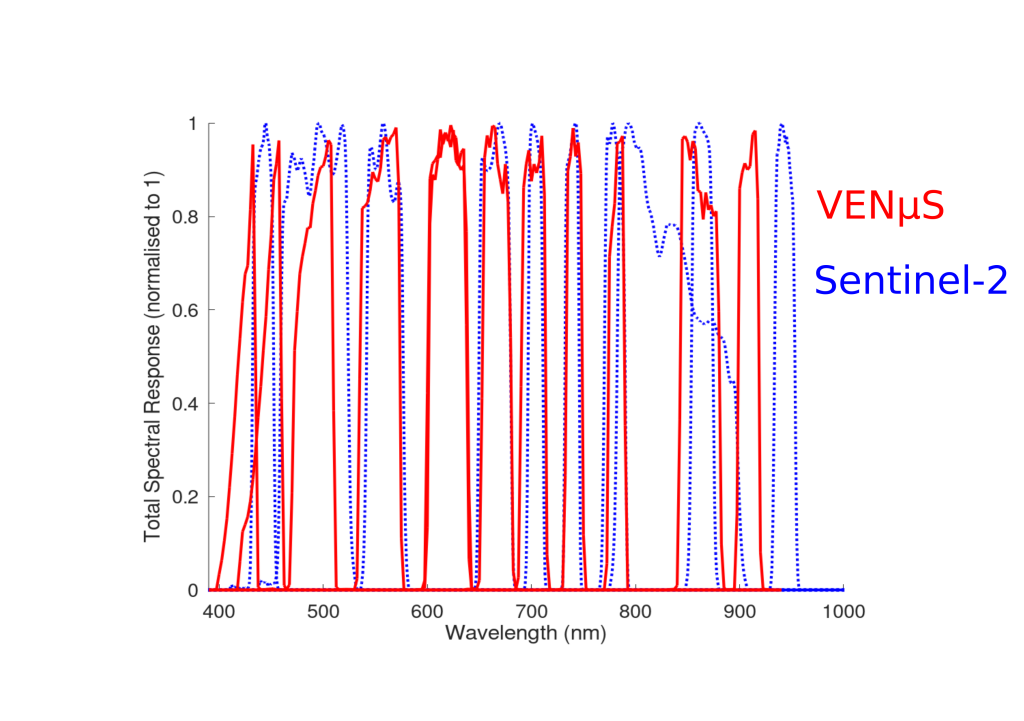
The figure below shows the spectral bands of VENμS and Sentinel-2 in the 400 to 1000 nm range. The SWIR bands of Sentinel-2 are not included.
The table below shows the usual band combinations


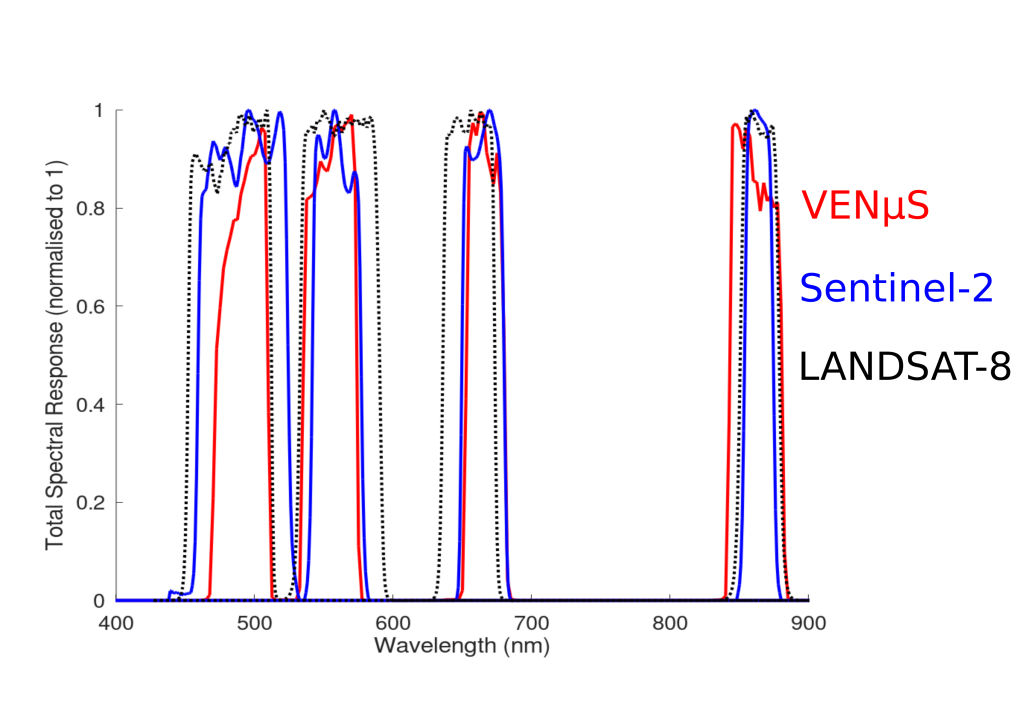
The figure below makes it possible to assess the degree of similarity of the spectral responses of these usual bands.
The detailed spectral responses of each instrument are available via the following web pages:

VENµS https://www.cesbio.cnrs.fr/multitemp/?page_id=14229

SENTINEL-2 https://earth.esa.int/web/sentinel/user-guides/sentinel-2-msi/document-library/-/asset_publisher/Wk0TKajiISaR/content/sentinel-2a-spectral-responses

LANDSAT https://landsat.usgs.gov/spectral-characteristics-viewerhttps://landsat.usgs.gov/landsat/spectral_viewer/bands/Ball_BA_RSR.xlsx

Plus d'actualités

IOTA2 software mailing list

Hello everyone, We have just created a mailing list for users of the IOTA2 software (iota2 — iota2 documentation). The tool will undergo significant developments in the coming months, and the purpose of this list is to communicate with the community to support these changes and to maintain the processing workflows needed by the users. […]

Rapid analysis of the GLOF in Gupis, Gilgit-Baltistan

Pakistan news media reported that a glacier lake outburst flood (the failure of a dam containing a glacial lake) occurred near Gupis, Gilgit-Baltistan, a highly mountainous region administered by Pakistan. Satellite images show that the flood triggered a debris flow, which reached the Gupis valley where it hit the Roshan (Rashon) village and blocked the […]

Dates de fauche en France

En 2024, des collègues du Cesbio ont publié un article* sur la cartographie de la date de fauche en France en 2022 à partir des données satellitaires Sentinel-2.   Leur magnifique figure 10 a attiré mon attention. La version à haute résolution fournie avec l’article (2861 × 2911 pixels) correspond à une image dont les pixels font […]

Rechercher