
Characterising the phenology of tropical rain forests in North Congo thanks to image time series at low and high resolution
 =>
=> 
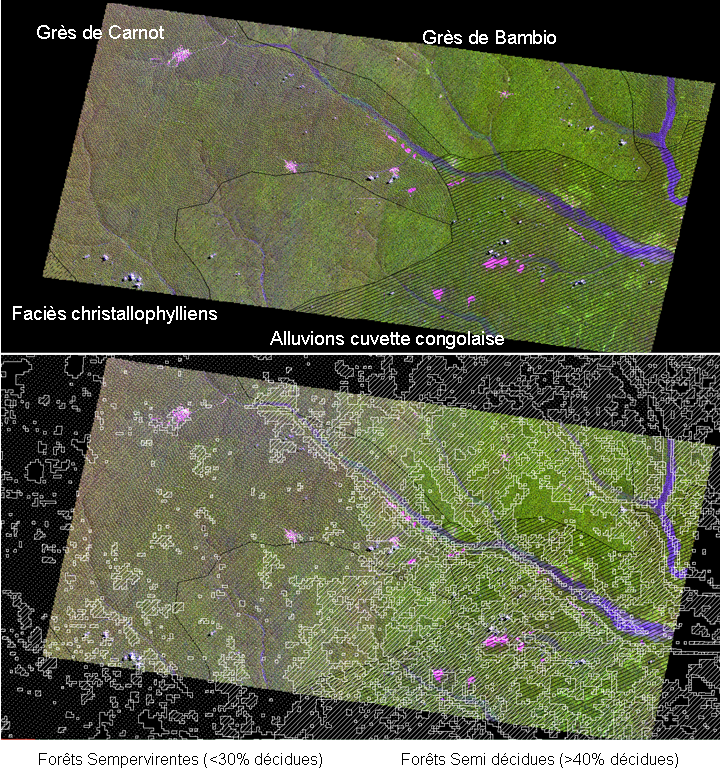
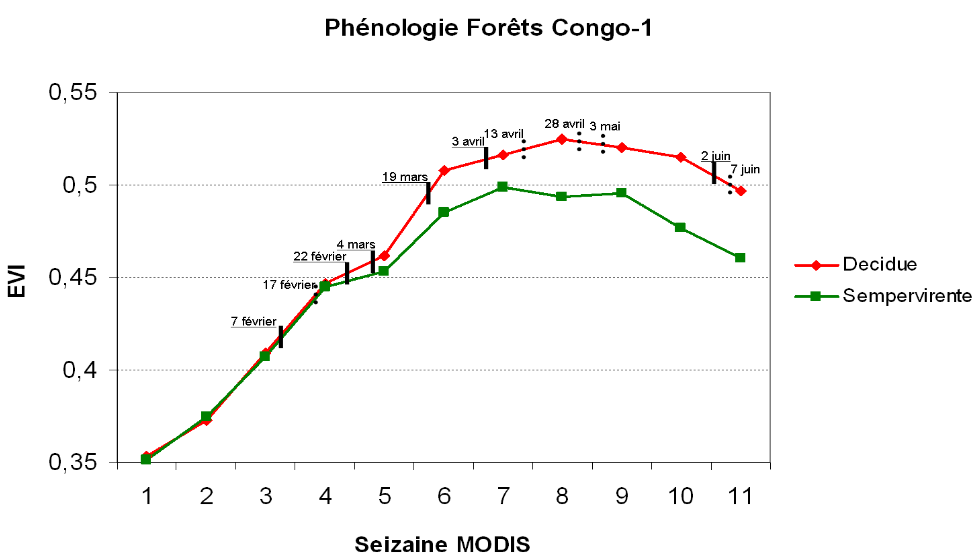
The CIRAD research institute studies the North Congo rain forests, and uses satellite image time series to tell mainly deciduous forests from mainly evergreen forests, The analysis or 10 years of a vegetation index time series (Enhanced Vegetation Index – EVI) from MODIS images at 500m resolution, was used to produce a synthetic annual profile that characterises the phenology of the observed forests (Gond et al., 2013), and enables to separate these two forests types. It seems that these variations in leaf phenology are partly related to the geology (Fayolle et al., 2012).
 |  |
|---|---|
| SPOT4(Take5) image from June 2nd: top, with the geological limits, sandstone in the West and silt in the west ; bottom, the vegetation classes obtained thanks to MODIS (mainly evergreen in the West and deciduous in the East. | EVI Temporal profiles of both forest types (evergreen and mainly deciduous) of North Congo between January and June by sixteen day periods. The black dashes mark the six clear SPOT4 (Take5) dates, and the dots mark the partially clear dates. |
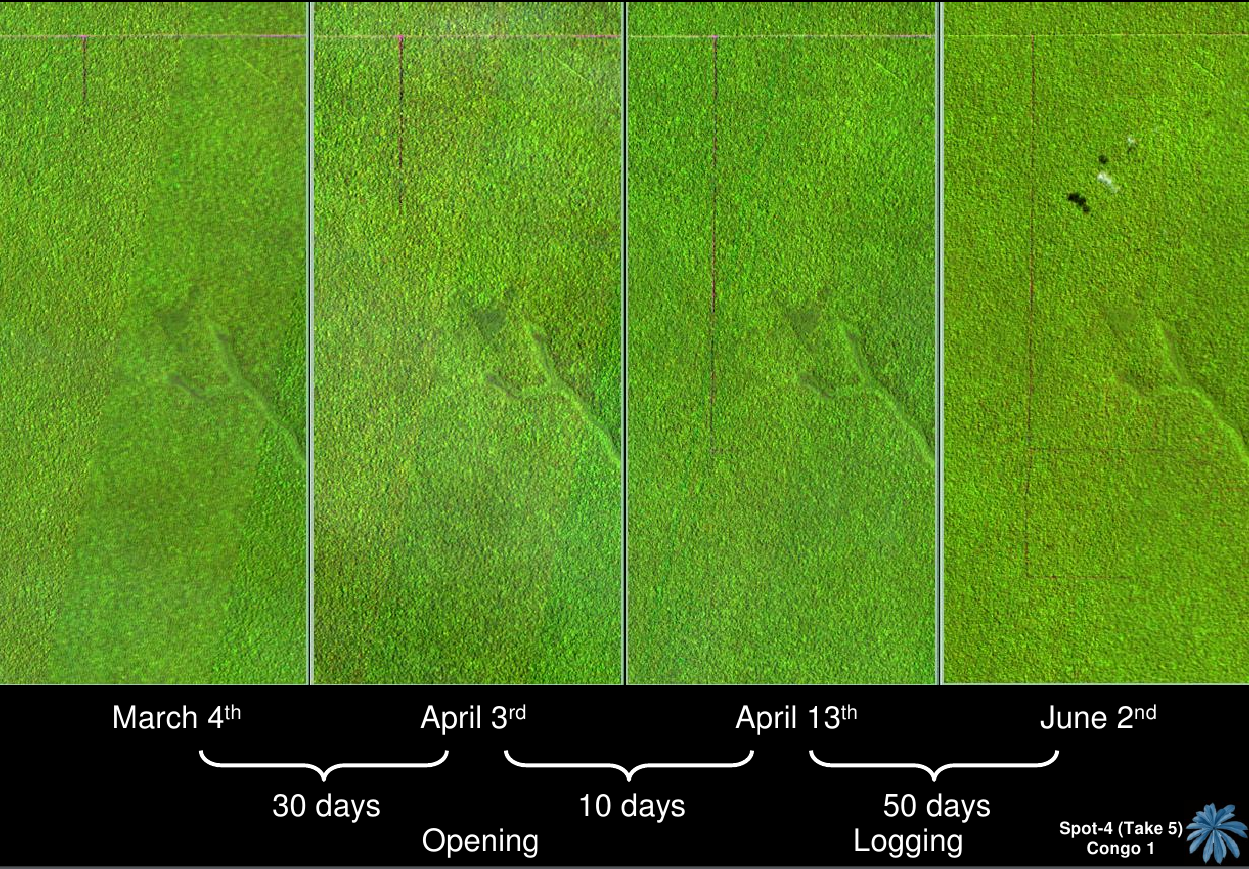
The SPOT4(Take5) experiment, which prefigures the data delivered by ESA’s Sentinel-2, enabled to obtain 6 very clear images between February and June 2013, which is exceptional in this usually cloudy region (the clouds were in Europe this year 🙁 ). These images will allow us to analyse temporal profiles of photosynthetic activity with far more details than with MODIS, which is useful to understand the behaviour of these forest types, and study in detail how the are related to the geology. This high temporal frequency data set enabled us to asses the possibilities of monitoring human activity in these rain forests. The images below, from SPOT4(Take5) show how a new logging track is opened by a company. It shows the capabilities of using Sentinel-2 data to identify and detect human interventions n the most remote places.
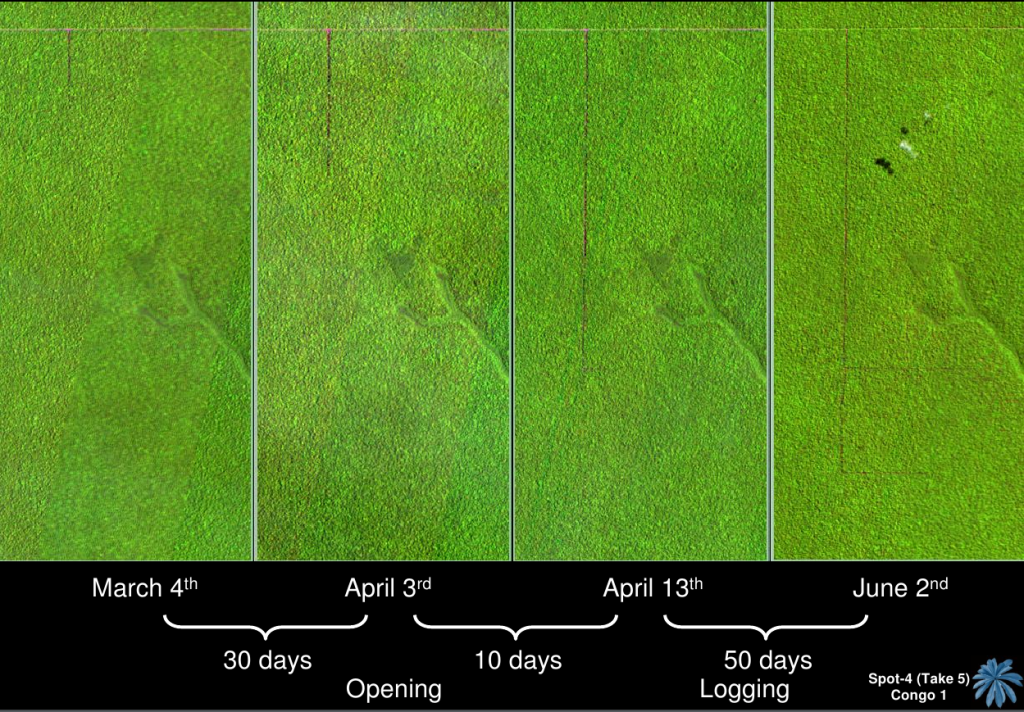
- 4 color images (SWIR, NIR and Red) in North Congo for 4 dates from March 2 June. A new forest track is being opened southward on the 4th of March, and goes further South until the 14th of April. From this date the track turns East, to access various forest sites. On the 2nd of June, the track is finished and the logging starts, it is clearly visible with a zoom.
ReferencesFayolle, A. Engelbrecht, B. Freycon, V. Mortier, F. Swaine, M. Réjou-Méchain, M. Doucet, J.-L. Fauvet, N. Cornu, G. Gourlet-Fleury, S. 2012 Geological substrates shape tree species and trait distributions in African moist forests PLoS ONE 7, e42381Gond, V., Fayolle, A., Pennec, A., Cornu, G., Mayaux, P., Camberlin, P., Doumenge, C., Fauvet, N., Gourlet-Fleury, S., 2013, Vegetation structure and greenness in Central Africa from MODIS multi-temporal data, Philosophical Transaction of the Royal Society (serie B), 368: 20120309Gourlet-Fleury, S. Rossi, V. Réjou-Méchain, M. Freycon, V. Fayolle, A. Saint-André, L. Cornu, G. Gérard, J. Sarrailh, J.-M. Flores, O. Baya, F. Billand, A. Fauvet, N. Gally, M. Henry, M. Hubert, D. Pasquier, A. Picard, N. 2011 Environmental filtering of dense-wooded species controls above-ground biomass storerd in African moist forests J.Ecol. 99, 981-990.

