
Building a global cropland mask, is not an easy task
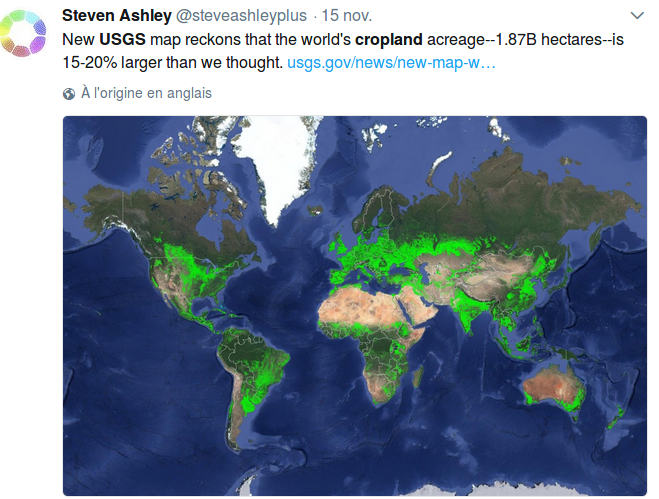
Criticizing is easy, and doing is hard, especially when trying to create a global map of croplands. Some collegues from CESBIO have worked on that subject within the Sen2Agri project, and obtained good resuts, but only at the local or country scale. Finding a method that works everywhere must clearly be much harder.These days, I have received a lot of emails, tweets and posts about a new cropland global product at 30 m resolution, edited by USGS. I have no doubt it was a serious work from a serious team, done with appropriate terrain data and methods, validation, and of course a tremendous data processing. But there it is, I checked it over a lot of places that I know very well, and it seems to me that the cropland mask, at least in South West France, is clearly overestimated. Is it the same in tour region ? Here are some examples :
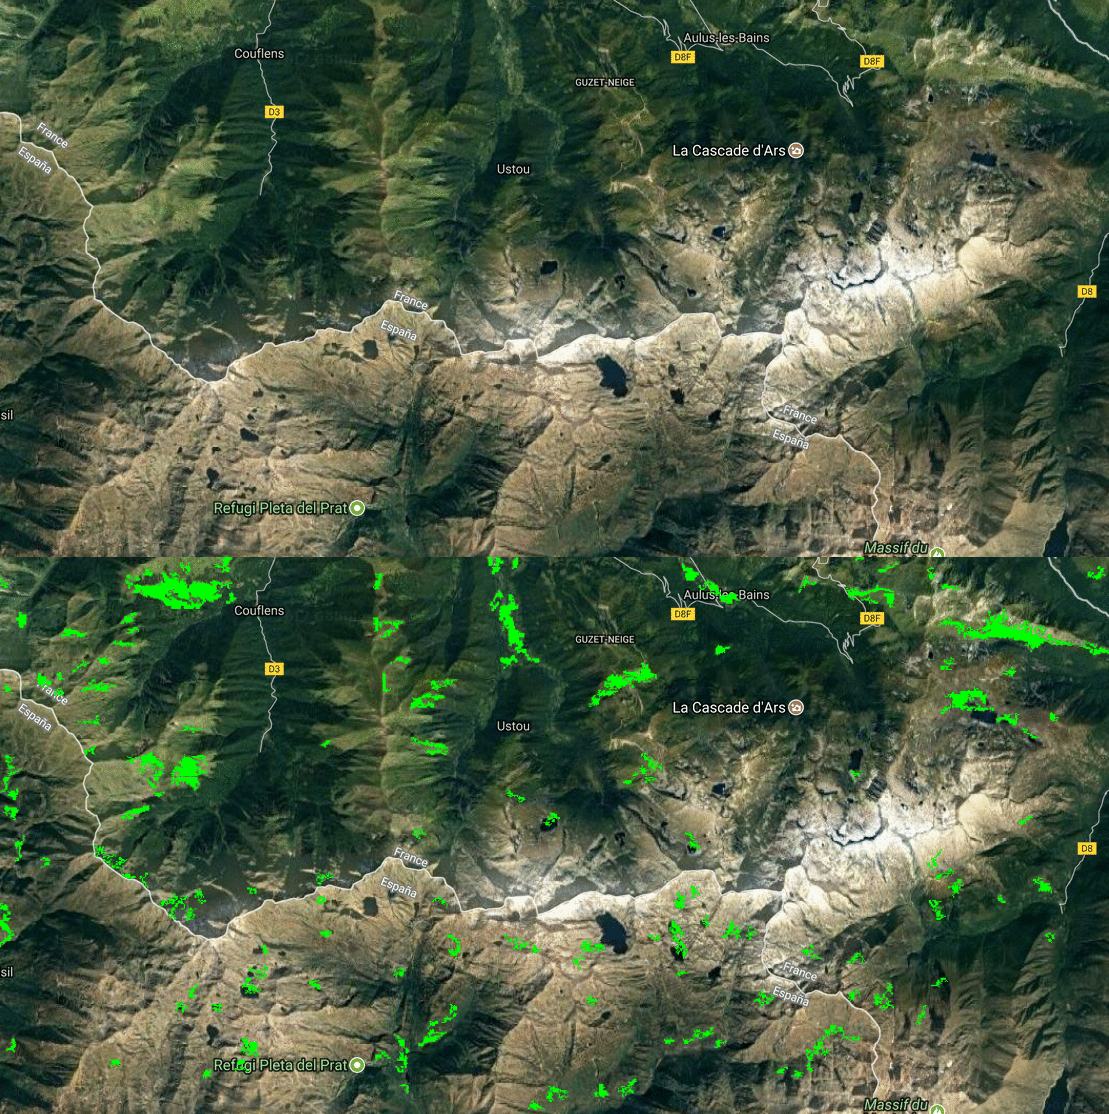
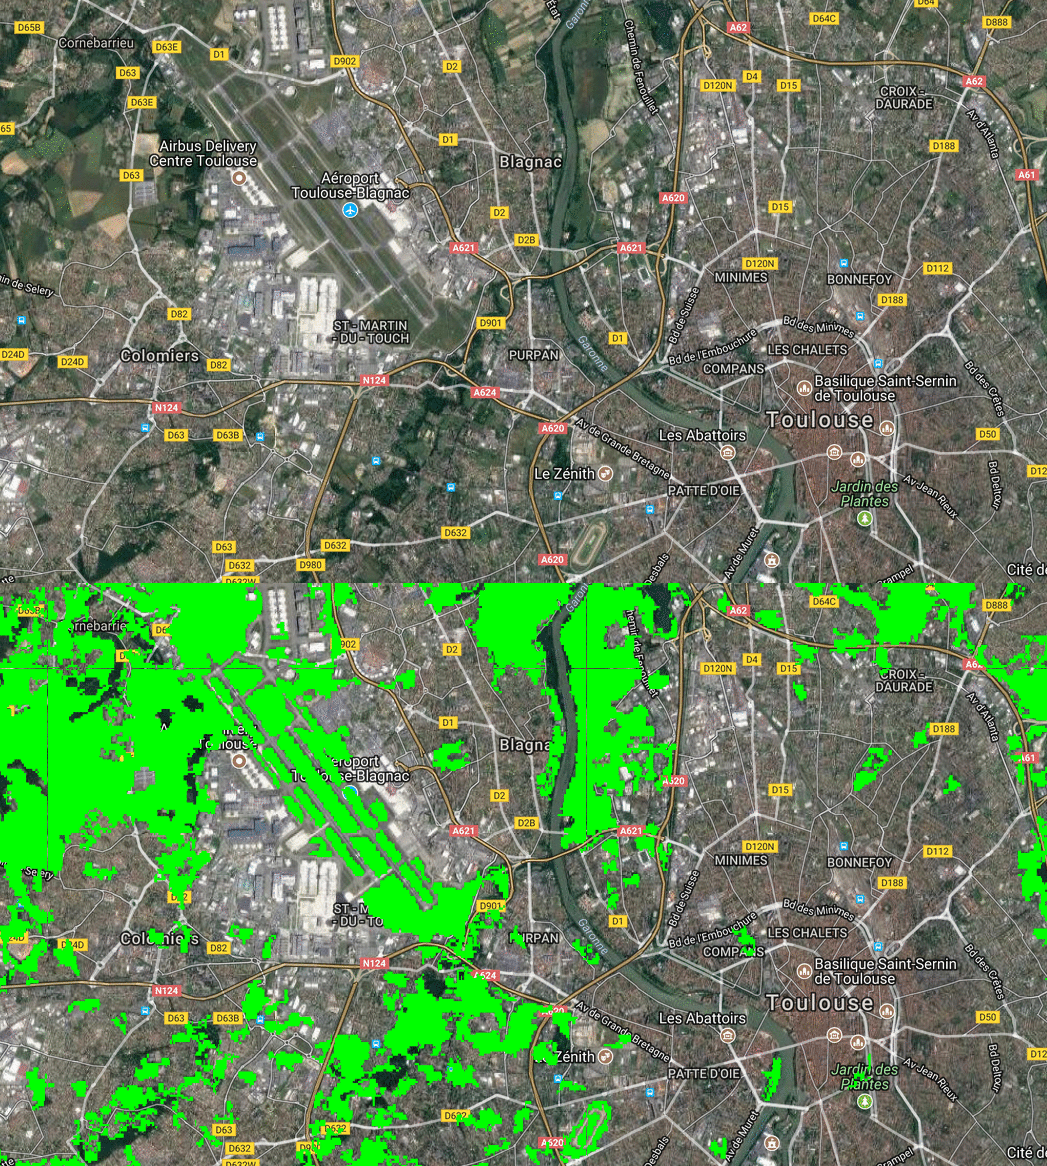
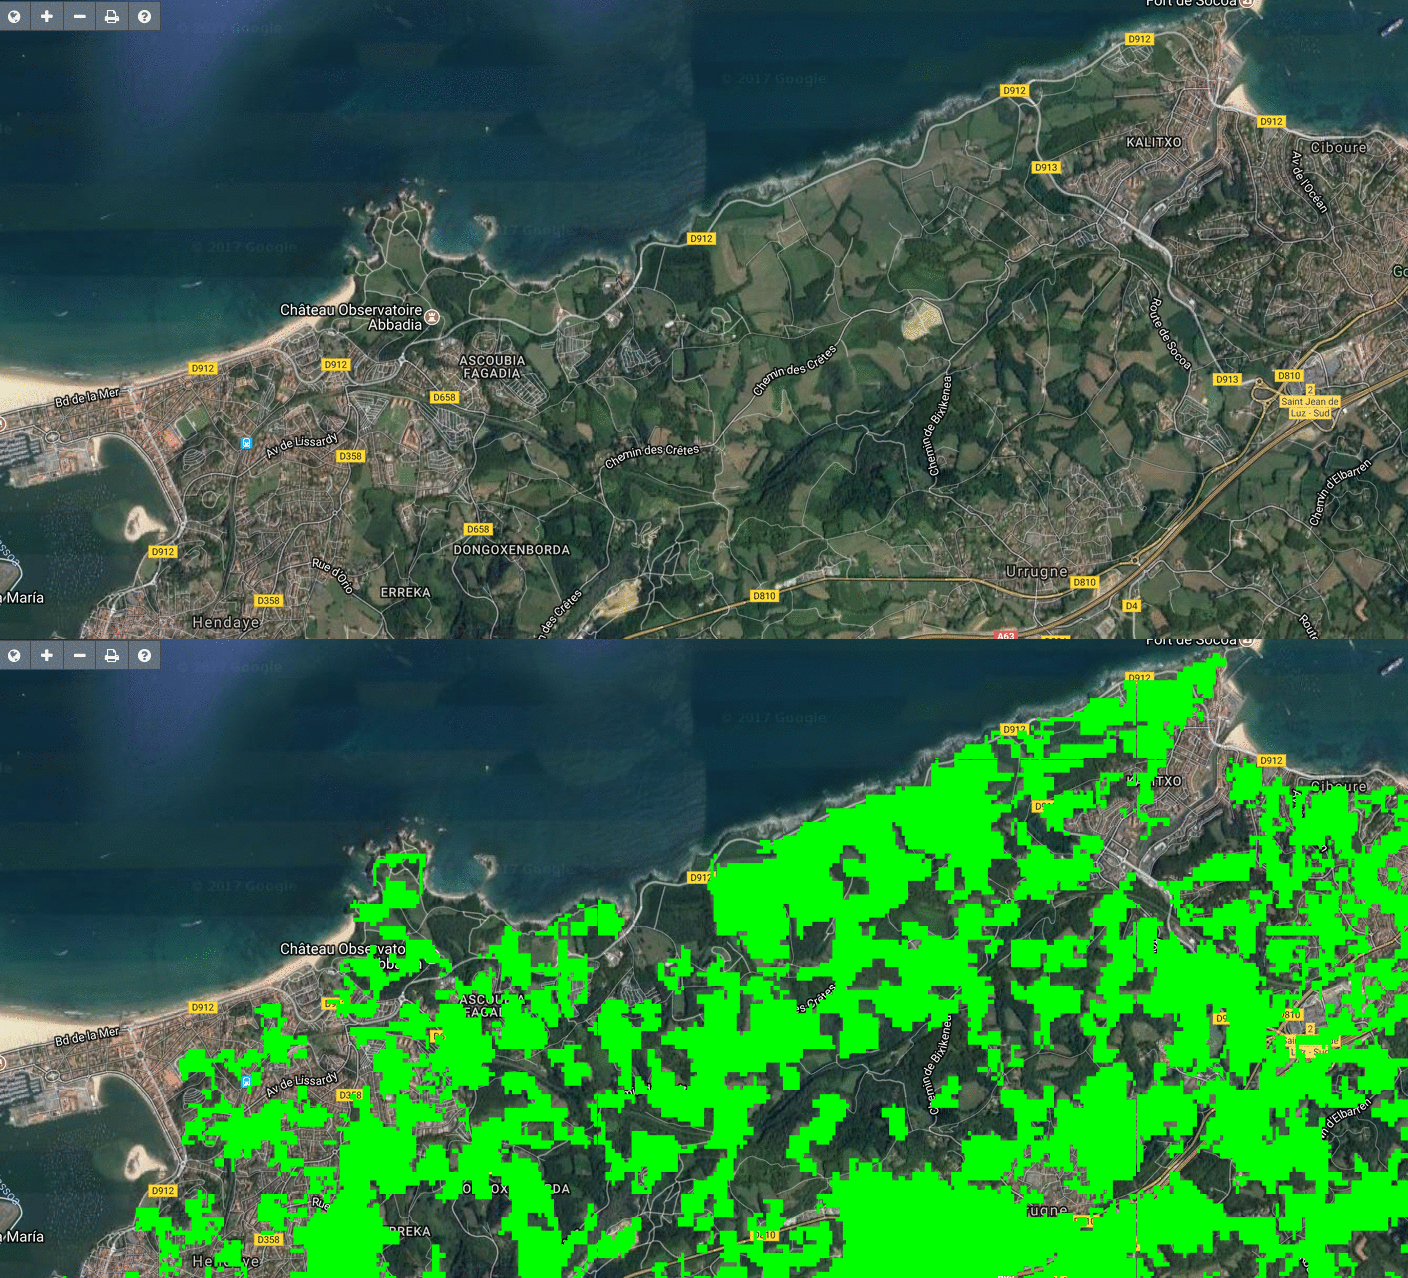
I took some more examples, randomly, in Spain and Scotland, where the results look alike :
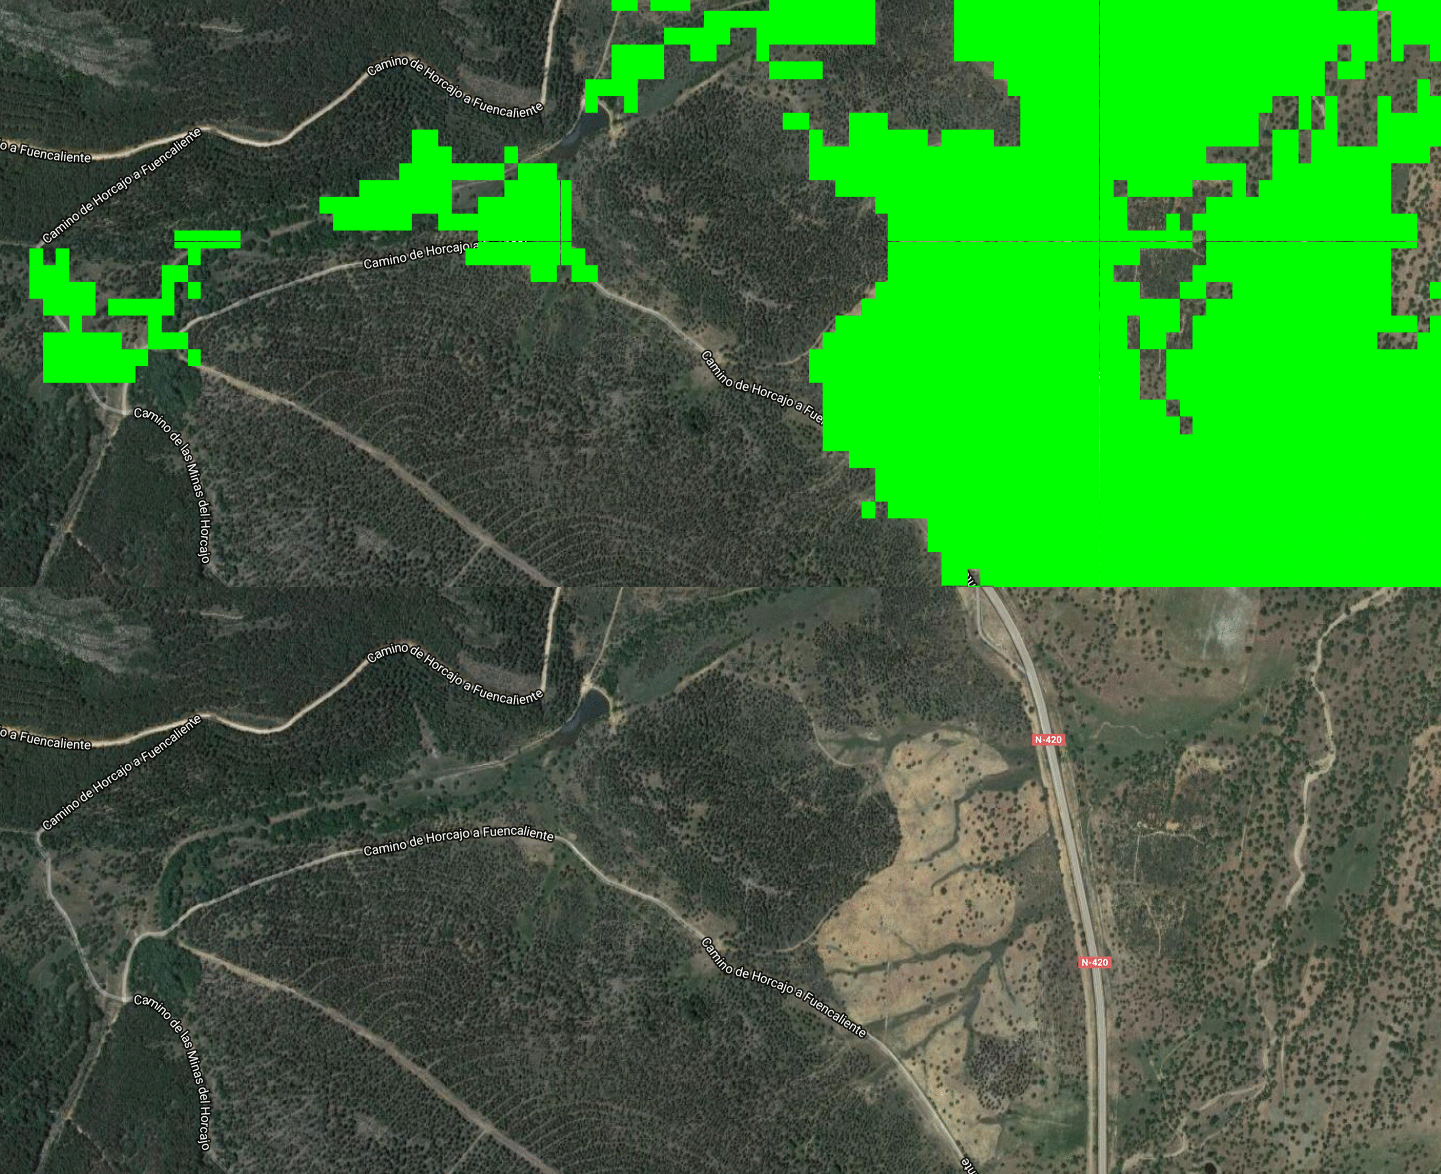
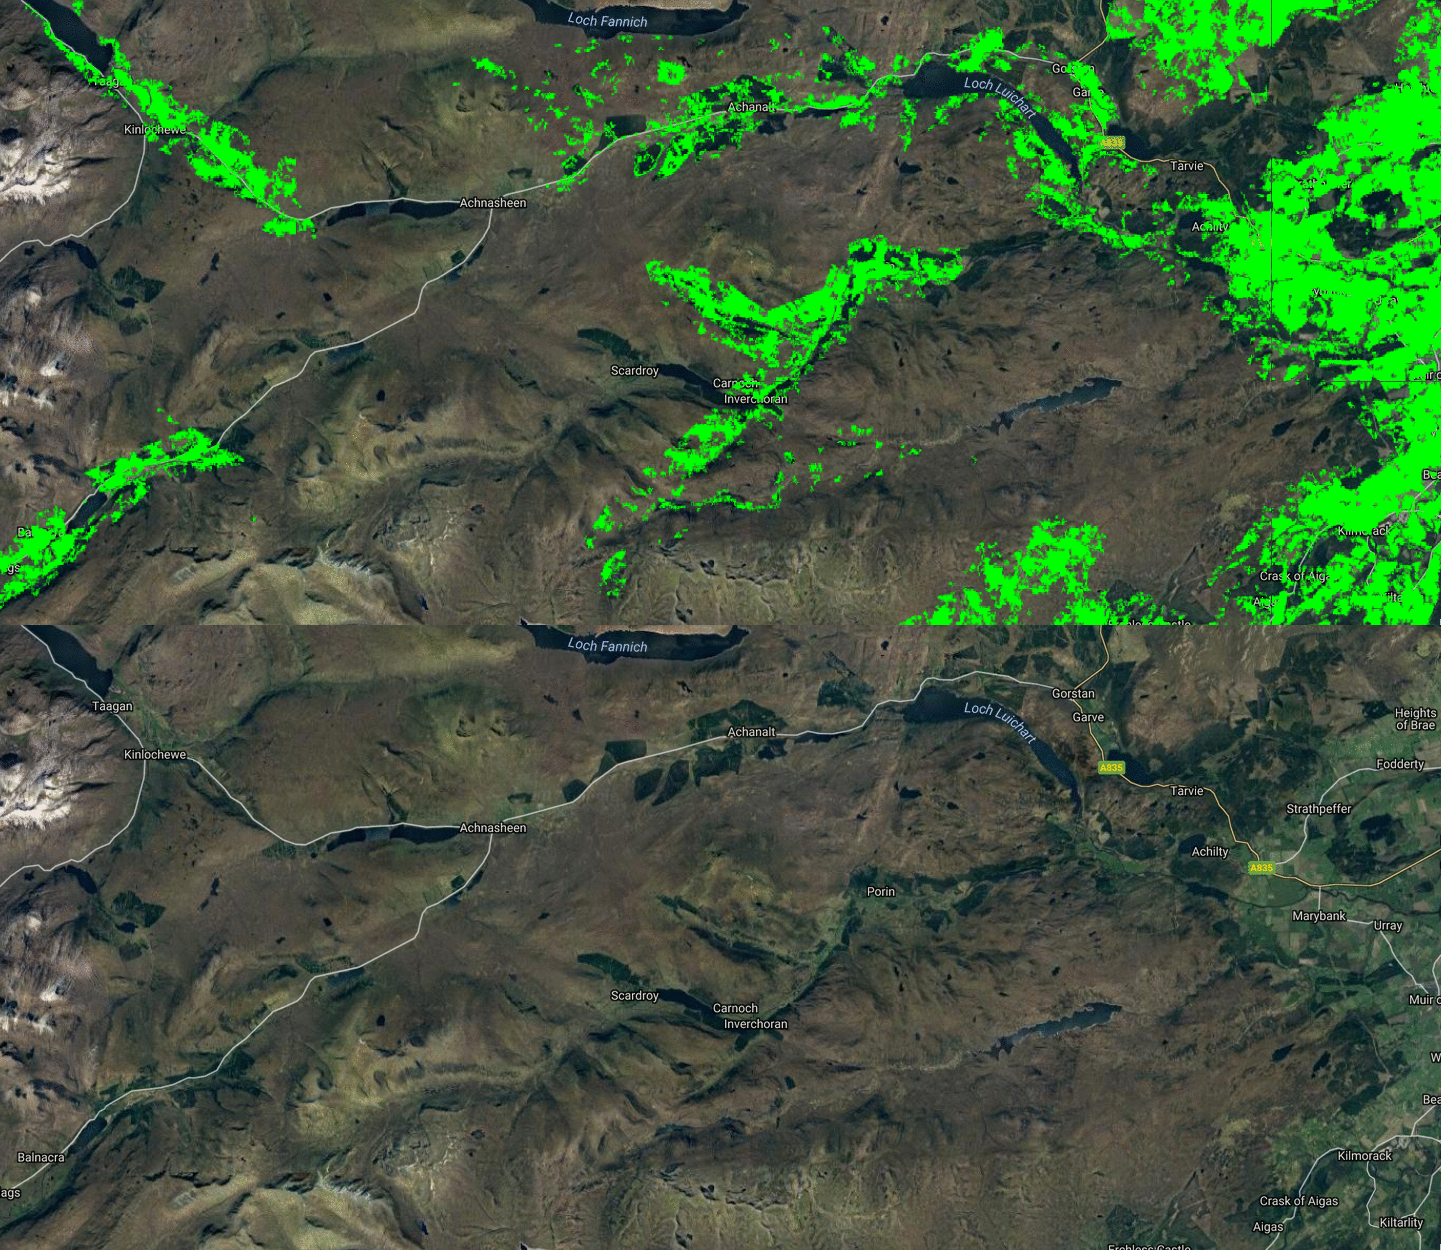
I did not find much information about the cloud mask validation in USGS data release. Maybe will it
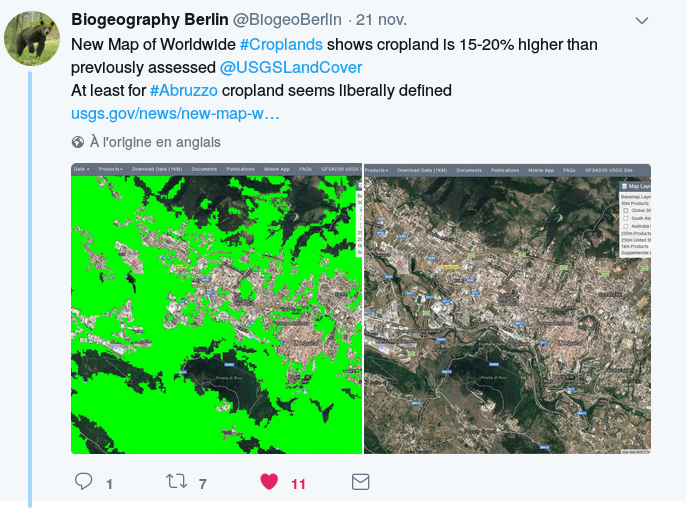
come soon, or did I overlook the articles ? As I have heard similar comments from colleagues in Belgium or Italy, this does not give too much confidence in the 15-20% increase figure quoted in the articles. But maybe the issue is only in Europe, and will be solved in next version ?

