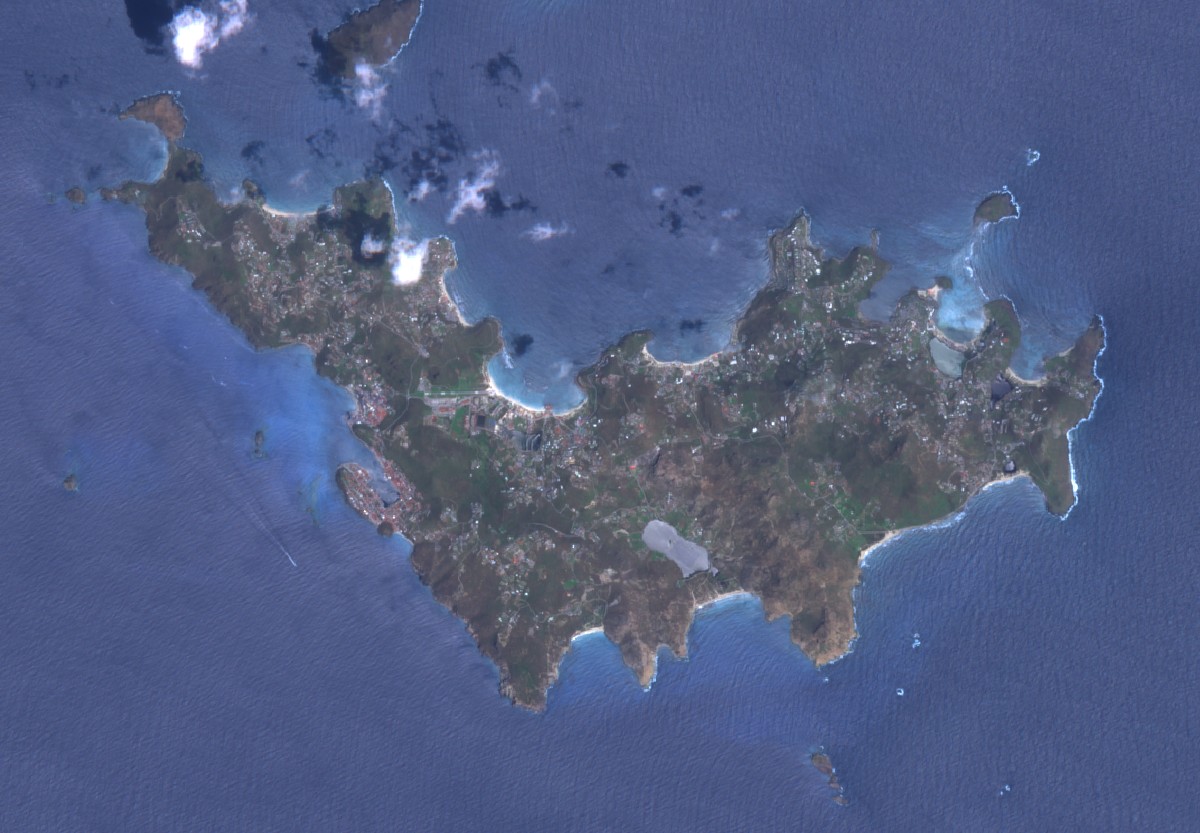
Aftermath of Mathew hurricane over Haiti in 2016
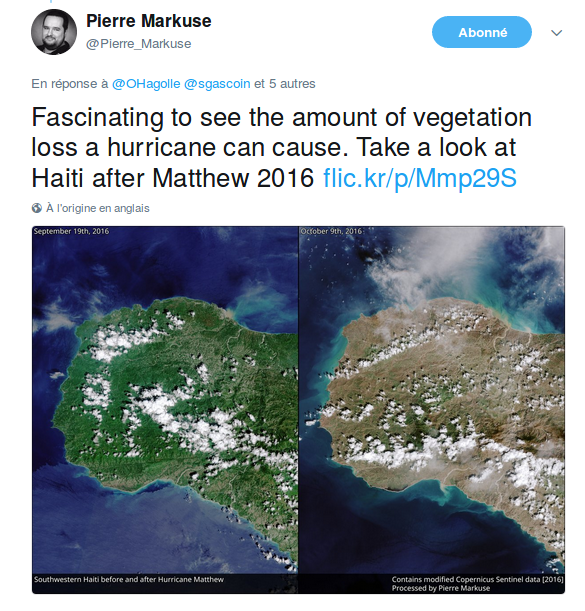
Following Simon’s publication on Saint Barthelemy island after Hurricane Irma, one of our twitter friends, @Pierre_Markuse, posted a comparison of the South Western part of Haiti, before and after Mathew huricane ravaged it last year, on the 4th of October 2016. As you can see, the whole lands turn brown just after the hurricane. I am really not an expert, so I just can imagine it is caused by the wind cutting branches and trunks and by water run-off taking the lower vegetation away. I read that 40% or the forest and 20% of the shrub has been erased. Moreover, the wind and water must have left mud and dust on the remaining leaves, contributing to the brown color. However, what is amazing is that by end of November, vegetation comes back ! My guess is that mud and dust disappear, shrubs and trees start to grow new leaves and the low vegetation grows back But experts are welcome to explain how it happens exactly, there is a comment section ! I have an additional special own interest in displaying this information : it is a hard test for how our multi-temporal methods included in MAJA to detect clouds, shadows and aerosols can manage such a case.
These methods are based on the assumption that the surface does not change quickly with time. It is generally true, but obviously wrong in that case ! To avoid MAJA giving nuts result of that kkind of cases, we do a series of tets to avoid finding fals clouds, false shadows or nuts aerosol content, such as using spectral tests, detecting large changes before estimating AOT…

Well, it seems the results are not too bad, with no exaggeration in the cloud cover, but also no missed cloud over land, and just, in the November image, some overestimation of the cloud shadows. The Sentinel-2 images L2A images produced by Theia are available for free at https://theia.cnes.fr. They are used in the framework of the Recovery Observatory for Haiti, funded by CEOS and managed by several CNES colleagues. They are also used as input in the Haiti Kalideos project . Both projects are done in collaboration with Haitian scientists and administration.