A first peek at new Sentinel2 geometric processing
If you are working with Sentinel2 products, you probably heard that ESA new geometric processing is active since 1st of April 2021. This new processing, based on the geometric refinement of viewing parameters with respect to a Global Reference Image (GRI), should bring absolute location error from 11 meters (95.5% of products) to better than 8 meters, and more importantly, multi-temporal registration from 12 meters (95.5% of products) down to better than 5 meters and even 3 meters for a single orbit (source: ESA Data Quality Reports).
At CESBIO, we know that the multi-temporal registration of Sentinel2 products may be problematic in some cases, and we recently developed a processing chain, named Stackreg that allows to quickly estimate relative location biases for a large amount of products. This processor computes offsets to apply to image geo-location information in order to improve stack spatial registration, as shown in this example video.
Top, from left to right: S2 stack wihtout registration, S2 stack with StackReg computed offsets, temporal derivative without registration, temporal derivative with StackReg computed offsets. Bottom : NDVI profile at red cross location without registration (blue), with registration (red) and registration amplitude (dotted gray).
StackReg in a nutshell
StackReg is a tool that I needed to develop on my way to a spatio-temporal fusion processing chain for the Sentinel-HR phase 0 study For a complete introduction, you can watch the talk I gave for a lab workshop: the slides (english) are available here, and the conference video (french) is available here. For those in a hurry, here are the main things to know about it.
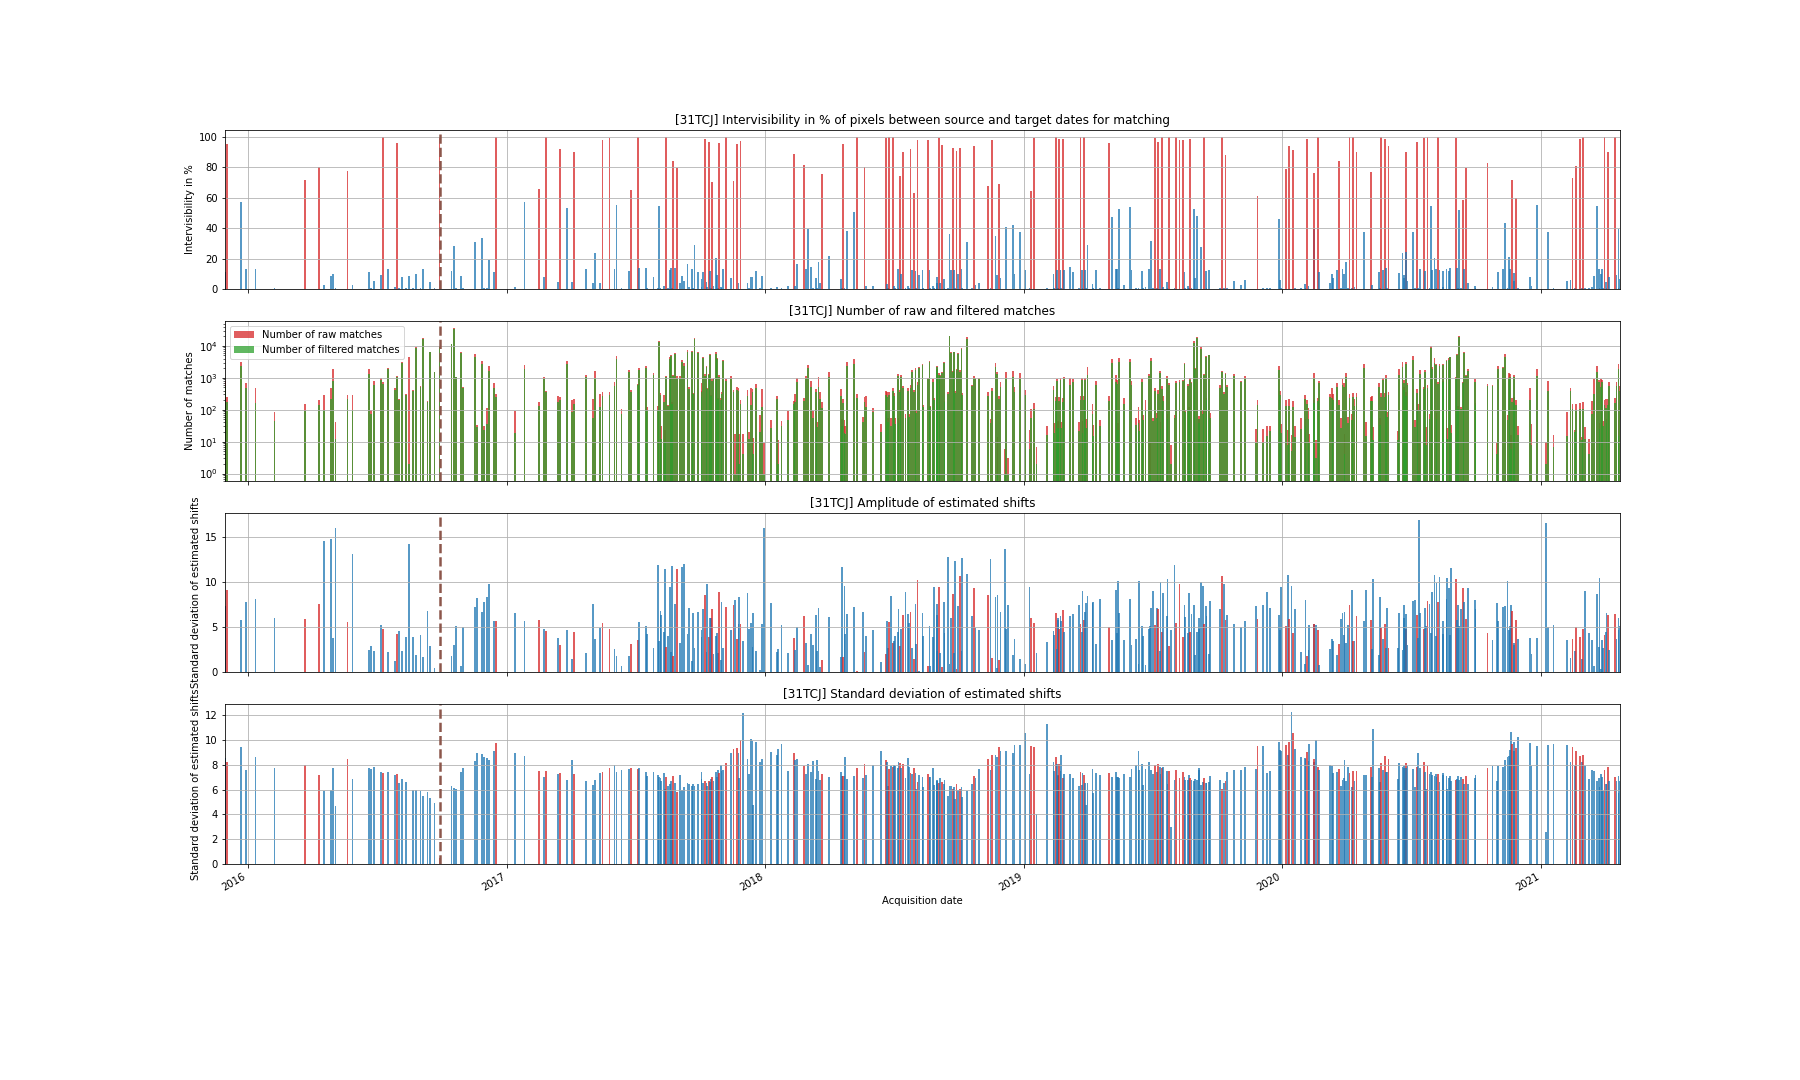
StackReg matches all images of a given Sentinel2 tiles available in Theia archive against the image with the highest ground coverage (excluding clouds, saturation, open waters and edges) with the SIFT algorithm, which will yield thousand of sub-pixels pairs of points called matches. Images are broken into sub-tiles, and matching is done at sub-tile level in order to reduce matching cost and discard obvious outliers. Once all matches to the target image are collected for a given image, matches that correspond to an offset of more than 20 meters are discarded since we know from Data Quality Reports that the mutli-temporal registration should be better than 12 meters. This process is similar to the one used in CARS (CNES open-source photogrammetry pipeline).
This matching process in distributed on CNES High Performance Computing center, and processing the full archive for one tile takes a little less than 15 minutes (once data have been downloaded).
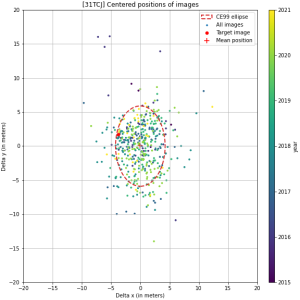
Once we computed the offset to the reference image for all images in the archive, we can derive the relative positions of all images in a space by considering the reference image as the origin of our frame. Since there is no particular reason for this image to be better than the others, we then compute the mean position of all images, and use this as the target position, from which we derive the offsets that allow to register all images together, as illustrated in the figure on the right. This kind of graph can also be used to analyse the geometric accuracy and multi-temporal registration of data (but not absolute location, we will get to that).
The list of offset is compiled in a csv file which is the only output of StackReg (storing StackReg outputs is therefore very cheap). This csv file can then be used to resample images or generate registered stacks on the fly (for instance using the WarpedVRT feature of rasterio).
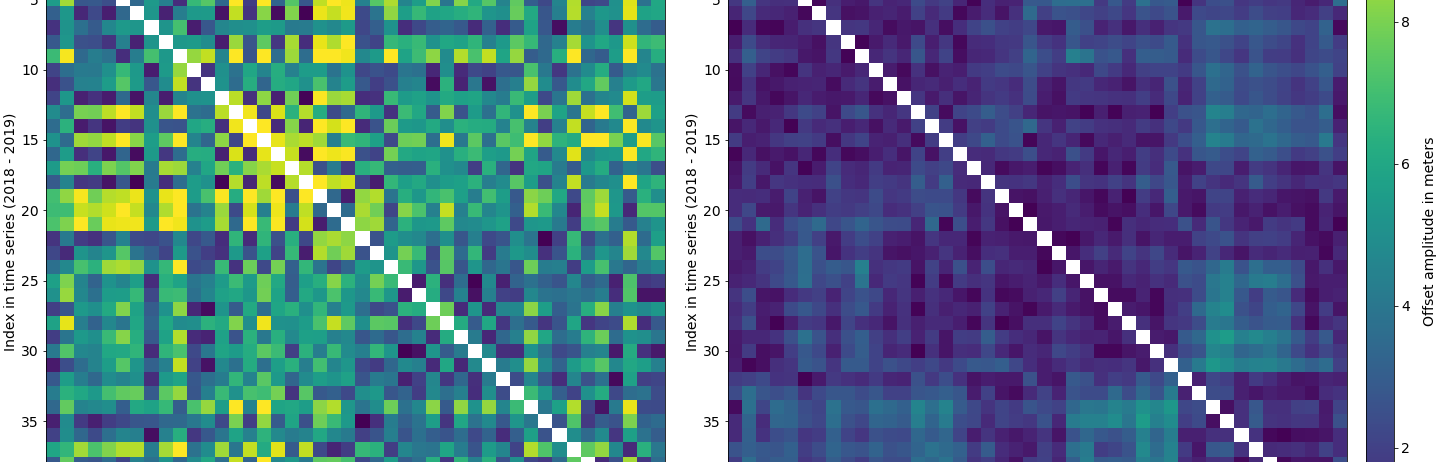
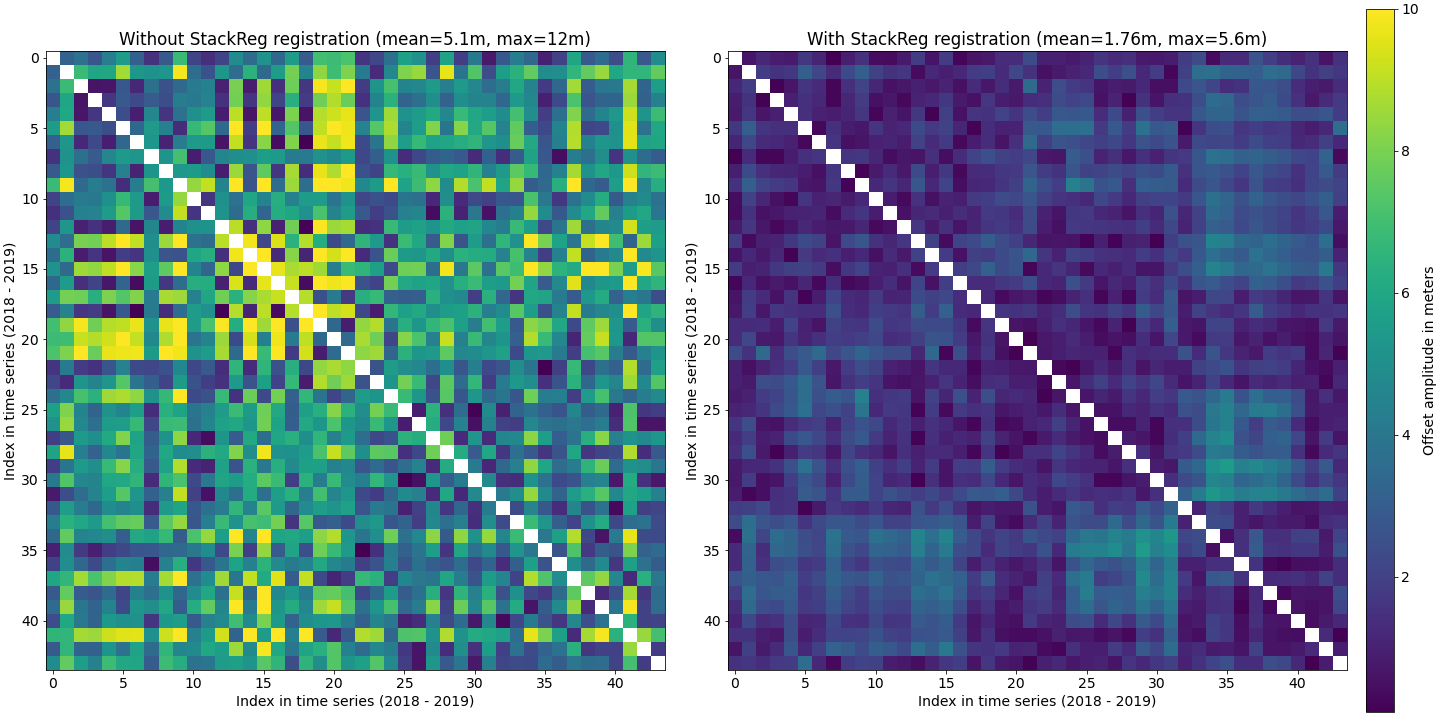
This yields a significant improvement of spatial registration consistency in the multi-temporal stack, even when considering pairs of images that have not been matched together, as shown in the following figure. From this figure, we can say that initial registration is coherent with Data Quality Report, and StackReg is very efficient in build a coherent multi-temporal stack.
What can StackReg tell us about Sentinel2 new geometric processing ?

We can use the same scatter plot diagram to see how images starting 2021.04.01 behave (date at which the processing is activated when possible), and see how StackReg locates those images with respect to the others. So here it is for tile 31TCJ. We can see that all the red crosses (with new geometric processing) fall into the confidence ellipse. Furthermore, they look quite grouped together, which suggest less jitter in image positions and supports the idea of a better 5 meters multi-temporal registration, except for one point at the bottom of the ellipse (but maybe the geometric processing was not active for this image). We can also note that, even if we do not have enough acquisitions yet to be sure, the mean of red points would be 2.5 meters north of the mean of the full cloud, which may indicate that we should rather use the mean of post 2021.04.01 images as our target location in StackReg.
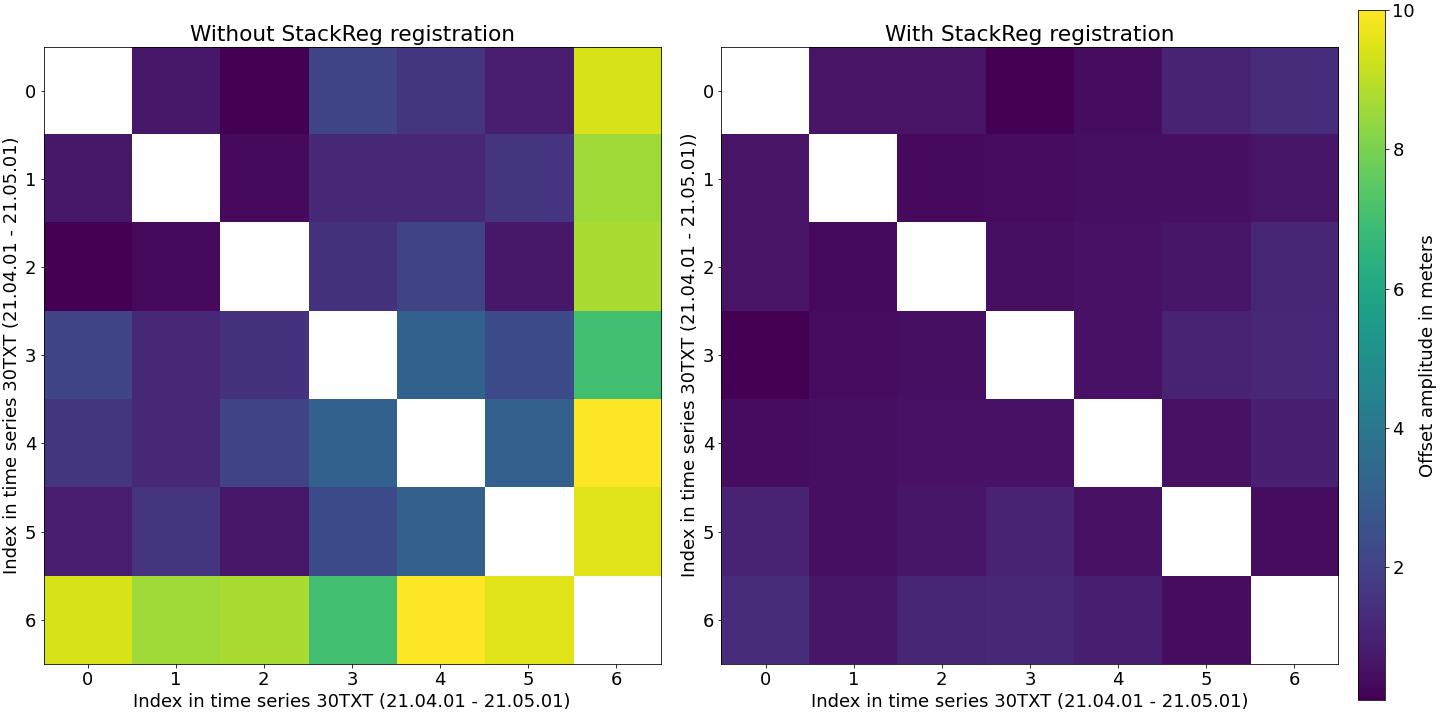
Indeed, if we look at the spatial registration coherency matrix for dates post 2021.04.01, we can confirm that coherency looks good with new geometric processing except from one image. We can also see that StackReg allows to slightly enhance the coherency and brings this faulty image back with the others.
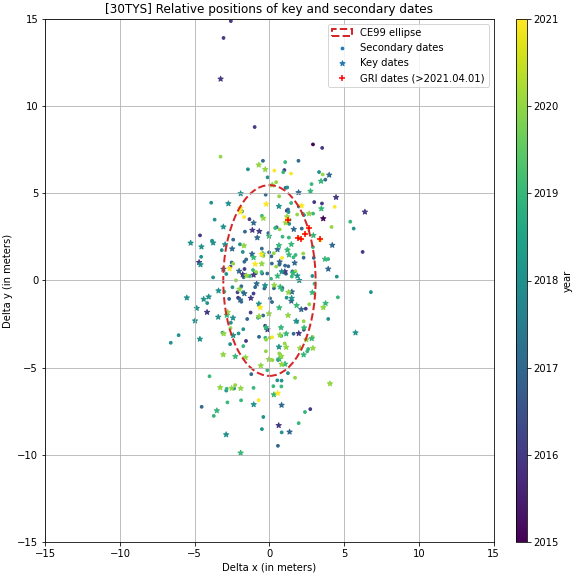
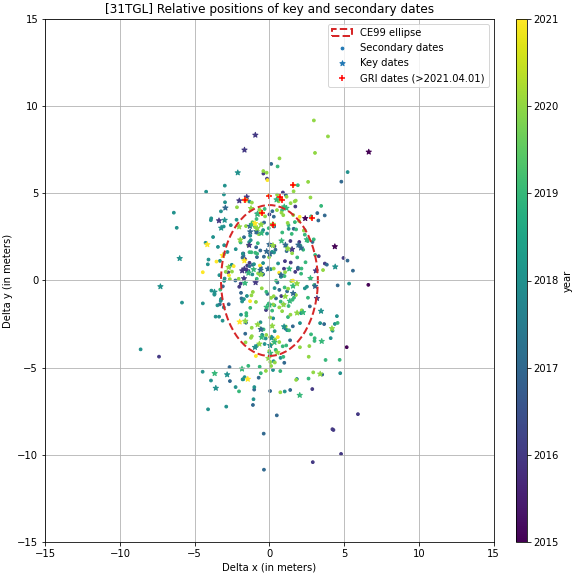
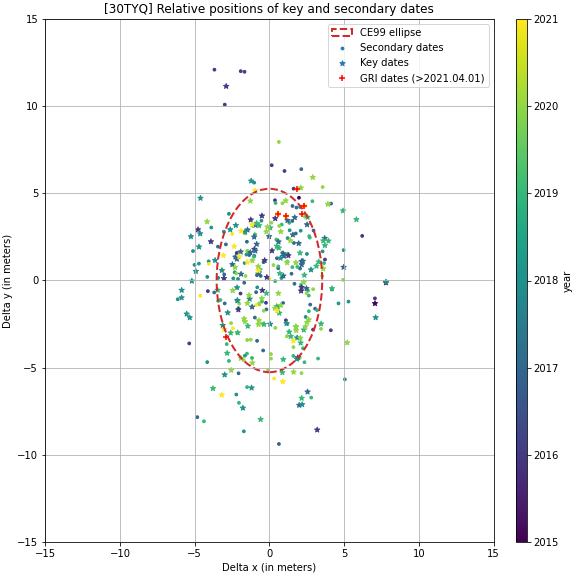
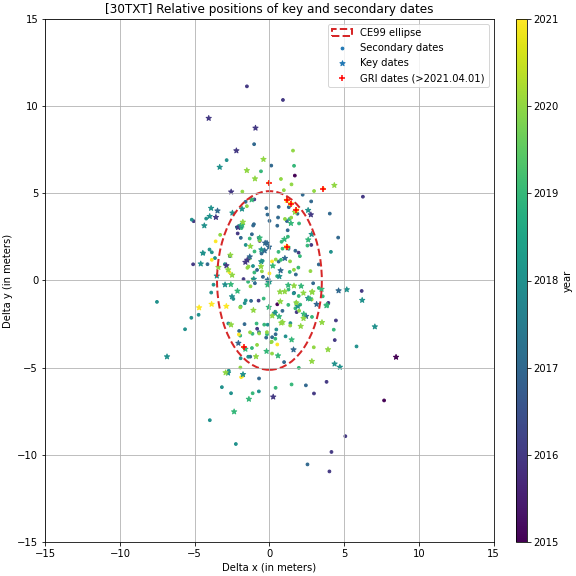
If we look at other tiles, we can see that the same conclusions can apply. 30TYS shows a very tight pack of acquisitions. Again, center of the cloud is not the center of the dates corrected by the new geometric processing, which suggest that we could use those dates to enhance absolute location of the full stack. 31TGL shows also a very tight pack, this time a bit further out our confidence ellipse. Once again, we are probably wrong and they are probably right. The same applies to 30TYQ and 30TXT (see graphs at the end of the post).
So what can we say? Of course, we will have to confirm this when more products will become available but … it works, folks! We only have to wait for the complete archive reprocessing (including L2A products) … In the mean time, StackReg can help building spatially coherent long Sentinel2 Time Series, help to improve further this coherency when dealing with products with new geometric processing, and sometimes catch outlier images and bring them back with the others. And we will have a closer look at the potential improvement of absolute location error by using mean location of dates with the geometric processing as the target location.