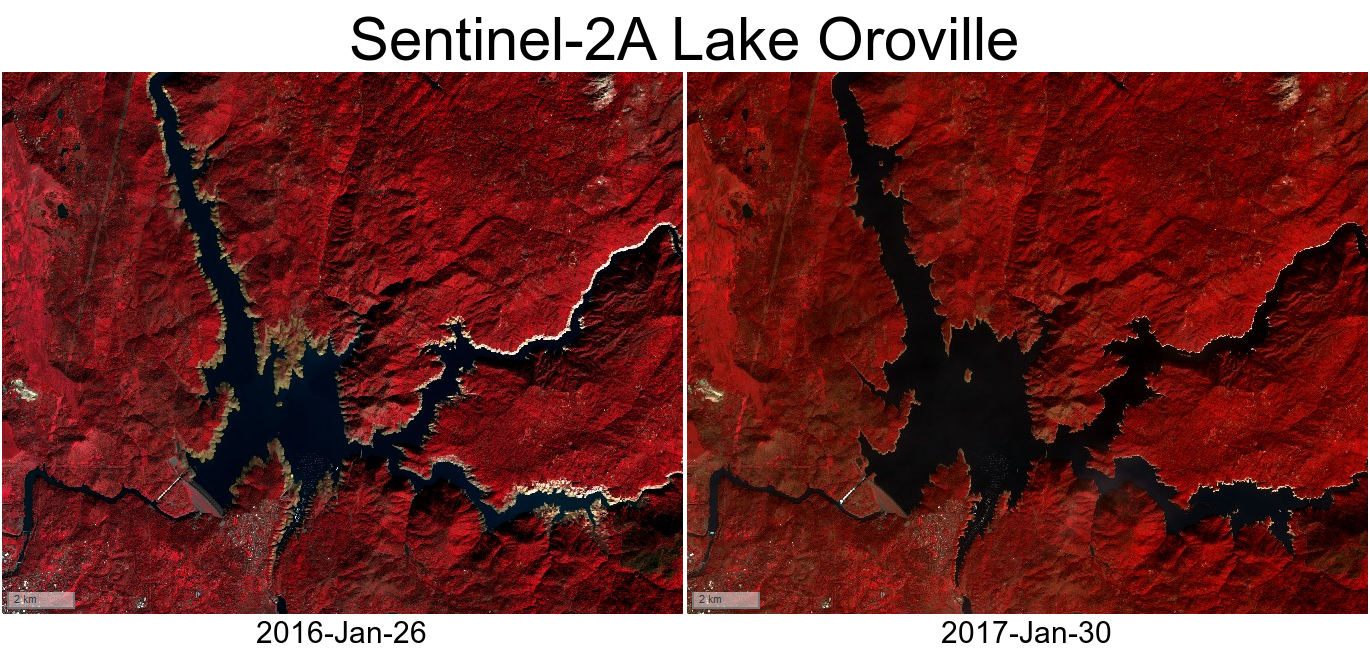
Lake Oroville in January 2016 vs. 2017

While California has just started to emerge from its worst drought in 1,200 years (2011-2016), it is now being hit by severe rainfalls, causing the evacuation of 188’000 northern California residents under the threat of spillway failure at Oroville Dam.


The Sentinel-2 mission began to monitor the western USA in 2016, so we can make an image comparison of the Lake Oroville in January 2016 (after five years of drought) and 2017 (after the heavy rainfalls). Here I used the NIR color composition (B8/B4/B3) in the Sentinel-Playground the highlight the contrast between the water and the vegetation surfaces.

As explained in this previous post, the normalized difference water index (NDWI) enables to better detect the lake extent.

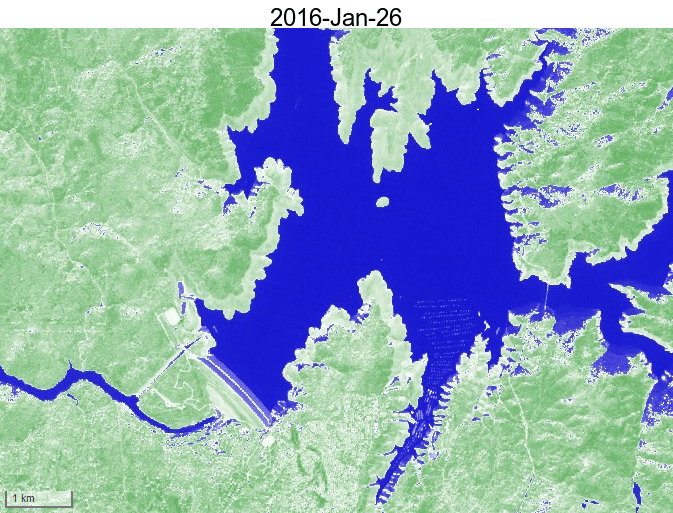
Here the NDWI is computed from level-1 images (top of the atmopshere reflectances). We can see that the water mask derived from the NDWI is not perfect in this mountainous region, as shaded (north-facing) slopes also have high NDWI values and can be confused with water surfaces. A better result could probably be achieved with level-2 images (top of canopy, flat surface reflectances).

Plus d'actualités

BIOMASS, the third launched satellite mission designed at CESBIO !

After SMOS in 2009, and VENµS in 2017, the CESBIO Laboratory is very proud to see its third proposed mission, Biomass, reach orbit. As always, it has been a long journey from the idea, at the beginning of the century, to the selection in 2013 as the seventh Earth Explorer Mission by ESA, to the […]

Sentinel-2 reveals the surface deformation after the 2025 Myanmar earthquake

Sentinel-2 captured several clear-sky images of Myanmar before and after the 28 March 2025 earthquake. The animation below shows a 5-day apart sequence of images captured by Sentinel-2B and Sentinel-2C (10 m resolution) near the epicenter located close to Mandalay. The surface slip due to the earthquake follows the Sagaing Fault, a major fault in […]

Evolution de l’altitude de la ligne de neige au cours des 41 dernières années dans le bassin versant du Vénéon (Oisans)

Pour contribuer à caractériser les conditions hydrométéorologiques lors de la crue torrentielle qui a frappé la Bérarde en juin, j’ai analysé une nouvelle série de cartes d’enneigement qui couvre la période 1984-2024 [1]. Grâce à la profondeur temporelle de cette série, on constate que l’altitude de la ligne de neige dans le bassin versant du […]

Rechercher