LANDSAT 5 & 7 acquired above France since 2009 soon released by THEIA
![]() =>
=> ![]() As for LANDSAT 8 a few weeks ago, we just produced the level 2A products for the LANDSAT 5 et LANDSAT 7 data acquired above France from 2009 to 2011. This data set will be released in a few days, when its transfer to the distribution server has ended. The MUSCATE team took charge of the processing for the THEIA Land data center, using CNES computing center. The data will be available on the following site :
As for LANDSAT 8 a few weeks ago, we just produced the level 2A products for the LANDSAT 5 et LANDSAT 7 data acquired above France from 2009 to 2011. This data set will be released in a few days, when its transfer to the distribution server has ended. The MUSCATE team took charge of the processing for the THEIA Land data center, using CNES computing center. The data will be available on the following site :
http://spirit.cnes.fr/resto/Landsat/
The processing methods and the data format are similar to the LANDSAT 8 data set described here. However there are also a few differences which are detailed below :
Starting point.
The starting point is not the same for LANDSAT 5 and LANDSAT 7 :
- For LANDSAT 7, as for LANDSAT 8, we start from Level 1T products provided by USGS. These products have a huge defect, with black stripes appearing away from the center axis of the image. These stripes are due to the breakdown of a mirror in 2003. The origin of this defect is described here. In our case, we decided to use only the central part of the images, doing a slight interpolation when the stripes are thin, and removing the data when the lack stripes are too large.

- LANDSAT 5 data acquired above France are not yet available at USGS. ESA owns these data and agreed to provide them (Thanks to Bianca Hoersh and Riccardo Biasutti from ESA, and to the SERCO company who processed the data). As a result, this data set is a unique data set, only available online here and nowhere else ! These data are provided at level 1G, for which the data have not yet been ortho-rectified. We had to ortho-rectify them at Theia, using CNES’s SIGMA tool, as for SPOT4 (Take5).
- Having a different approach for both sensors has a drawback. The grounc control point data base used at USGS seems to have some errors in France, and for instance, the location errors near Toulouse have a bias of about one pixel southward. It is not the case for the LANDSAT5 data ortho-rectified by THEIA, and therefore, one may observe registration errors in a time series involving LANDSAT 5 and LANDSAT 7 images. ESA’s data also have some defects, which are presented at the end of this post.

Resampling to Lambert’93 projection
Level 1T data are provided with the UTM projection. This projections uses three different zones over France, for which the registration of data is not direct. We decided to resample the data on a Lambert’93 projection, which is the official French projection. Of course, the LANDSAT5 have been directly projected in Lambert 93.
Tiling of products

We chose to tile the data in 110*110 km tile s spaced with a 100 km interval, as it will be done for Sentinel-2. The (1,1) tile is in the SouthWest corner of France. The tile of Toulouse is the 5th to the West, and the 2nd to the North. It is named D0005H0002 (D for « droite », H for « Haut »). For Corsica, a different tiling made of 2 tiles was defined. For each tile, we provide the whole set of dates for which a LANDSAT 5 or 7 image intersects the tile. A few date may be missing, for several reasons, in general related to the cloud cover :
- The image was not acquired by LANDSAT 5 or 7 (when a 100% cloud cover is forecast, the image is not acquired).
- The image was acquired but not processed to L1T by LANDSAT7 at USGS, or to L1C at CNES, because the cloud cover prevented from using a sufficient number of ground control points
- The Level 2A processing rejects images with more than 90% of cloud cover.
Level 2A processing (atmospheric correction and cloud screening)
First of all, we would like to outline that our processor does not process the themal bands of LANDSAT For the visible, near and short wave infrared bands, we use the same method as for SPOT4(Take5). It involves also the MACCS processor, developed and maintained by Mireille Huc at CESBIO. It is based on multi-temporal methods for cloud screening, cloud shadow detection, water detection as well as for the estimation of the aerosol optical thickness. However, thanks to LANDSAT spectral bands, our processing was enriched compared to SPOT4 (Take5). Thanks to the blue band, we have an additional criterion to detect the aerosols, thanks to the quasi constant relationship between the surface reflectances in the blue and in the red above vegetation. The precision gain due to this criterion compensates for the precision loss due the lower repetitivity of LANDSAT images. Finally, as there is no 1.38 µm band on LANDSAT 5 and 7, the detection of high clouds is much less easy than for LANDSAT 8.


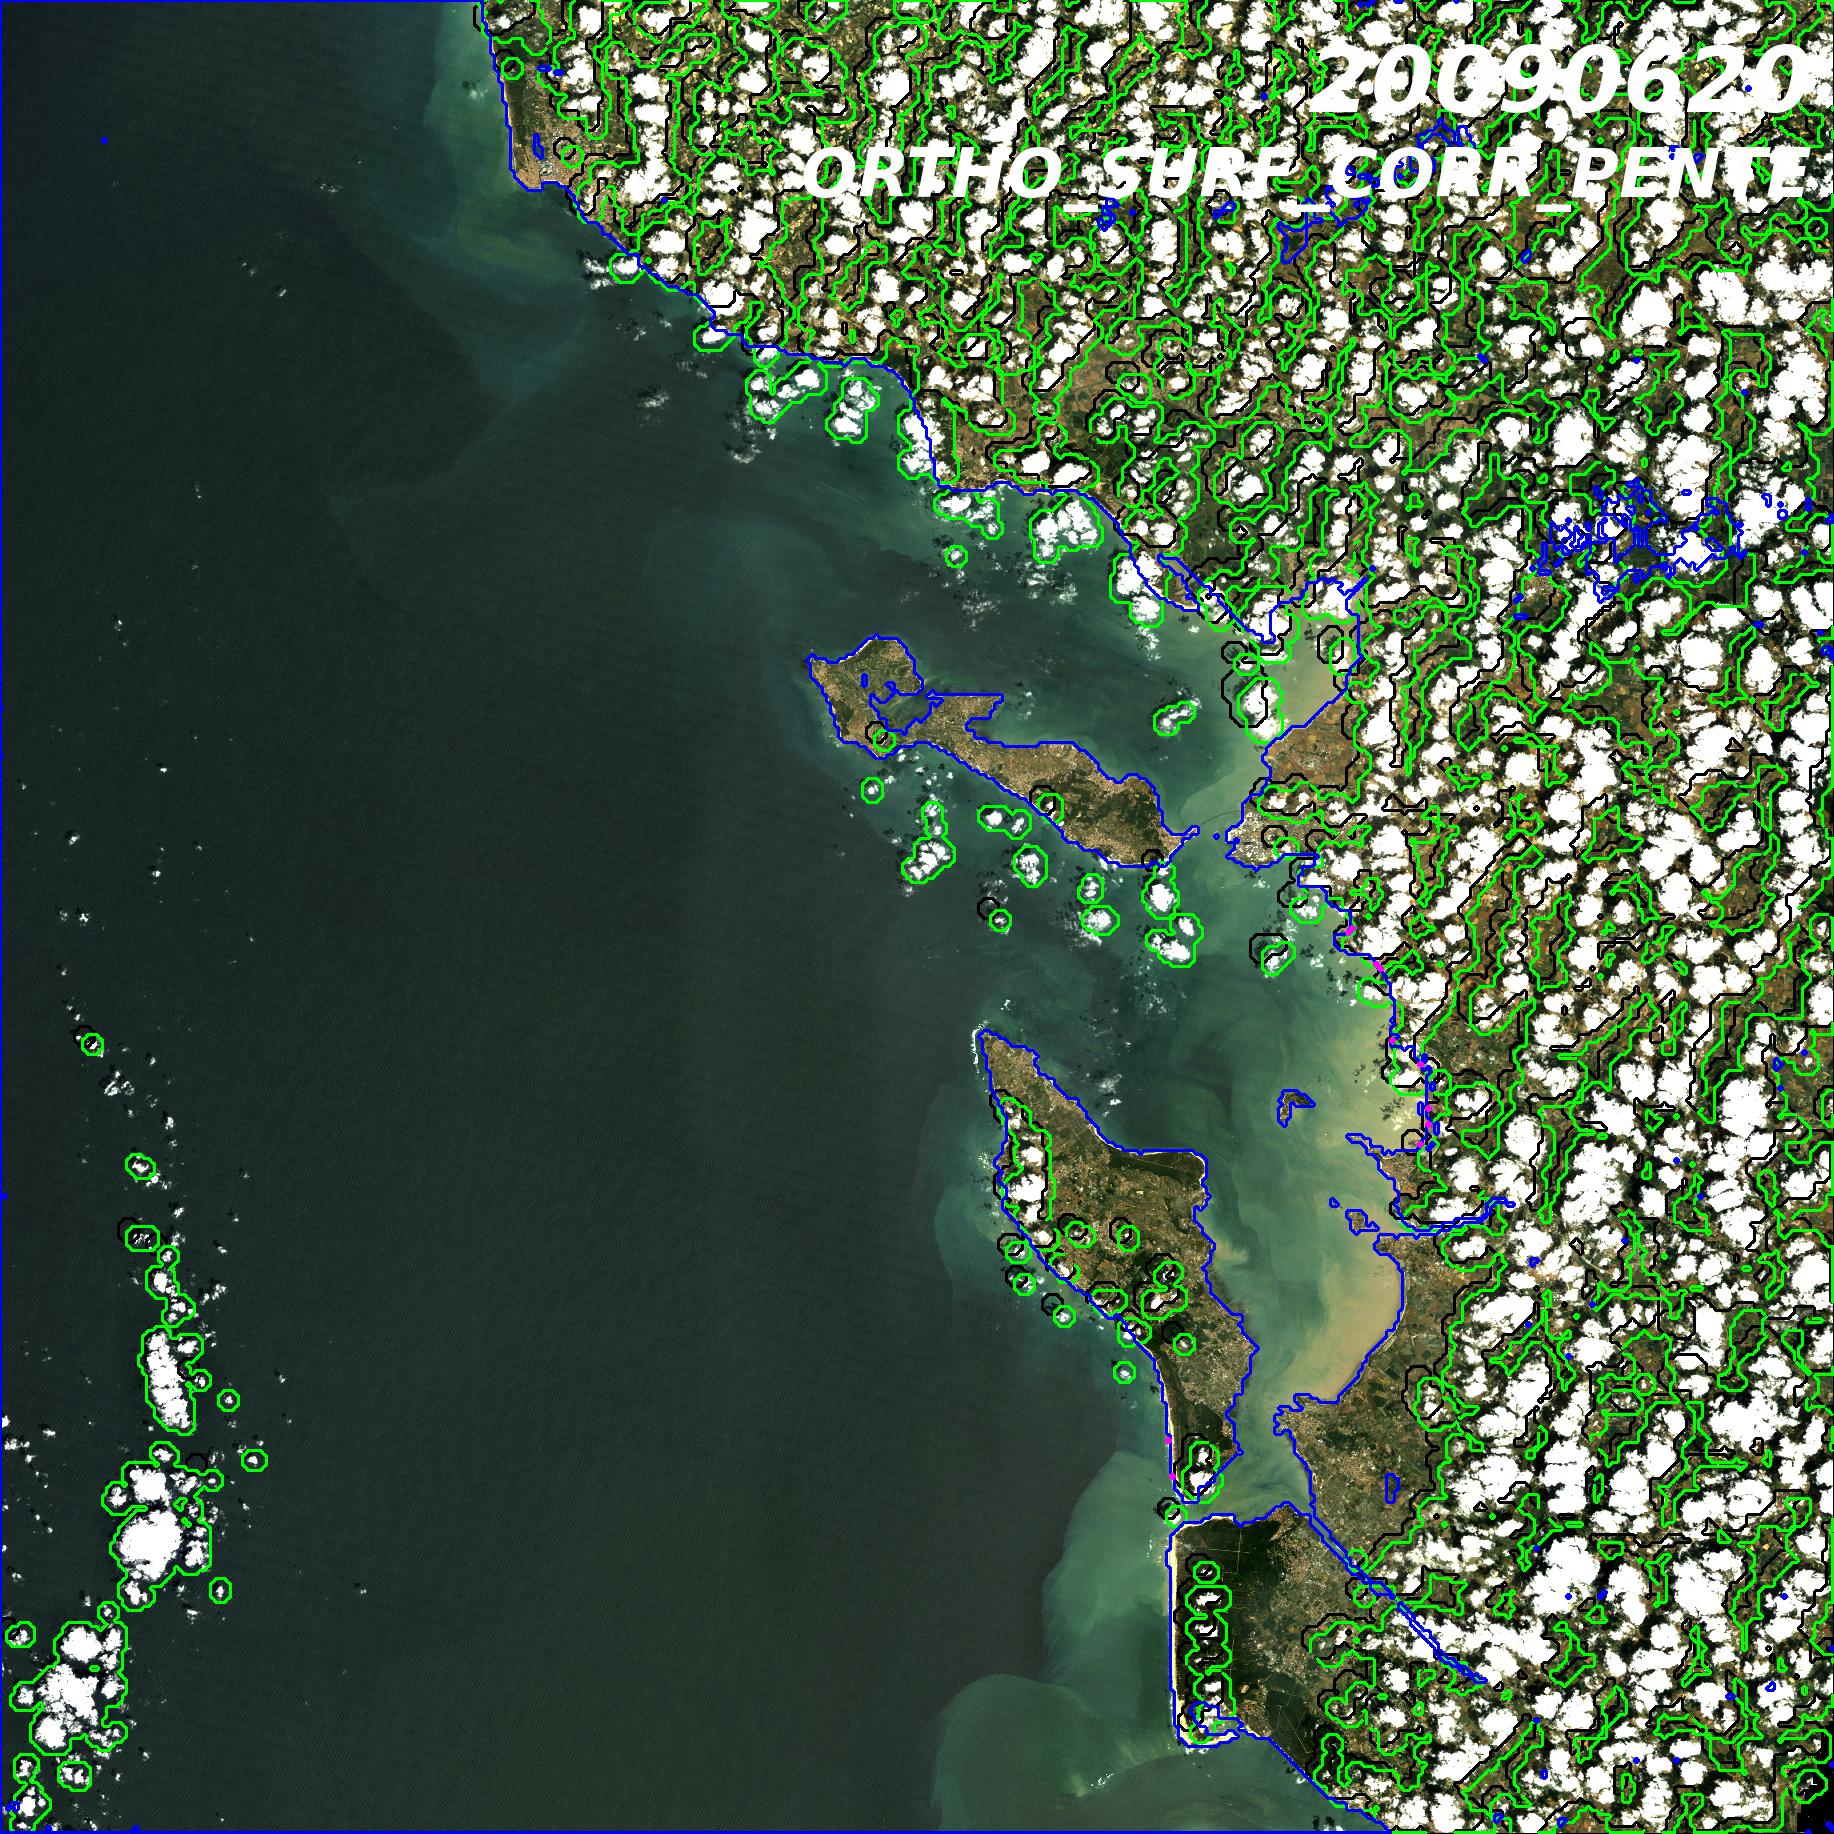
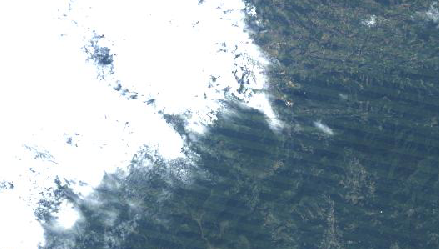
Images of one of the Atlantic Coast tiles, coming from different LANDSAT Paths (left and middle, tracks 201 and 200). The viewing angles are slightly different as the left image was observed from the West and the rmiddle image from the East. On the right, a Landsat7 image from track 201 reduced to its central part.
To increase repetitivity of observation which is essential in our multi-temporal method, we decided to use time series that merge LANDSAT 5 and LANDSAT 7 data as well as LANDSAT 5 data coming from adjacent tracks. As these data are not observed under the same viewing angle (+/- 7 degrees), but the angle difference is small enough to increase precision on the overlap zones, even if it may cause the appearance of artefacts in the AOT images.
Data Format
For LANDSAT 5 and 7, we used the same format as for SPOT4 (Take5).
Known issues :
Here is a little list of known defects for THEIA’s LANDSAT 5 and 7 L2A products :
– reference data for ortho-rectification at USGS may be biased by more than 30 m (38 m in Toulouse). The Landsat 8 data could be misregistered with the LANDSAT 5 data ortho-rectified at CNES using a national geographical reference.- LANDSAT 5 TM instrument electronics have an « afterglow » issue, that causes the appearance of whiter stripes perpendicularly to the satellite track near very bright zones such as a large cloud.- ESA’s LANDSAT 5 products have some random bright spots that appear as colored spots in color composites.

– in LANDSAT products, the « nodata » value that tells if a pixel is outside the image is 0, which is also a value observed within the image. Sometimes pixels may be identified as nodata when the are in fact within the image. It happens mainly over sea, where the medium infrared reflectance is often equal to zero. In this case, all the bands have the nodata value which, in our products is -10 000, to avoid the same difficulties for subsequent users.