
The V2.0 of SPOT4 (Take5) data set is available.
 =>
=> 
Voilà ! The new version (V2.0) of SPOT4-Take5 data set is available, for the 45 sites. I would like to thank the development and processing teams of MUSCATE center in CNES, who work for THEIA, the image quality teams at CNES (SI/QI and SI/MO), and of course Mireille Huc at CESBIO, for the production of this new version, which finally required a lot of work.The product version number is not included in the filenames, but you can recognise a V2.0 product by looking into the xml metadata file :
<METADATA> <HEADER> <VERSION>2.0</VERSION>
This reprocessing brings the following new features :
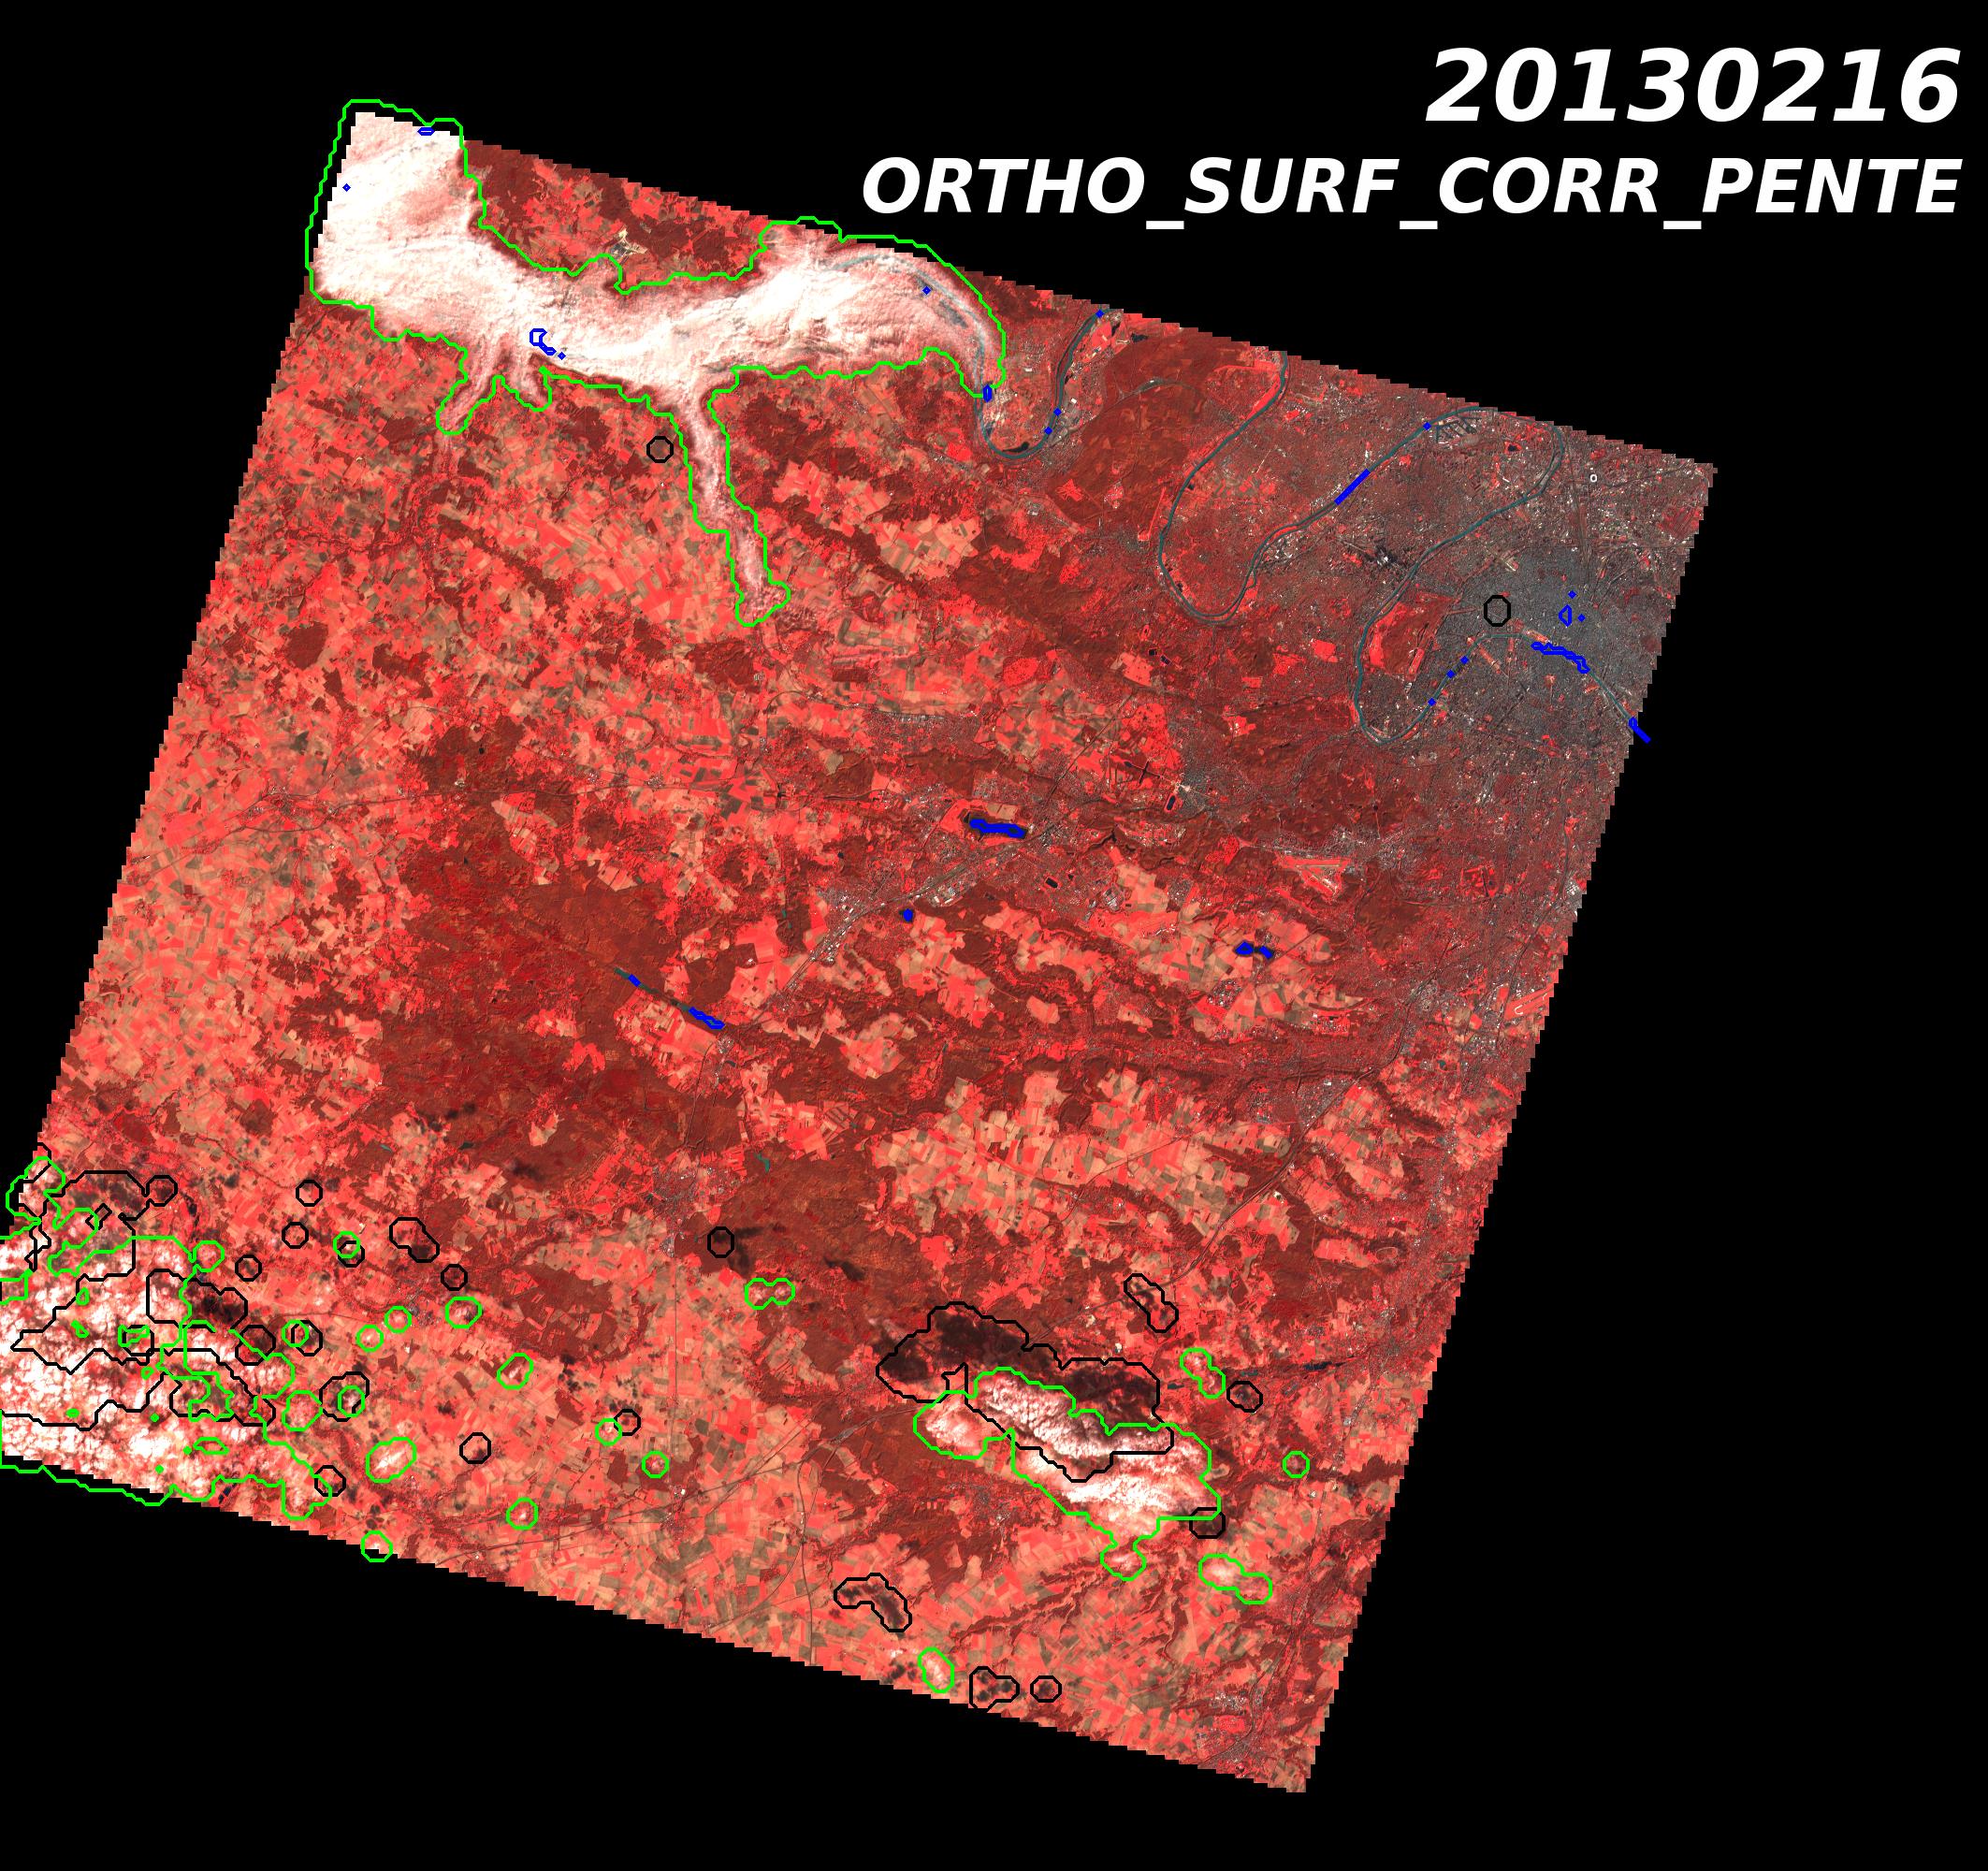
- We enhanced the quality of the ortho-rectification :
- By changing the référence ortho-image for the sites in France (GEOSUD, processing done by the french institute for geography IGN)
- by replacing the LANDSAT 5 otho-images by LANDSAT 8 images for most other sites outside France. LANDSAT 8 geometric performances are enhanced compared to LANDSAT 5.
- however, for a few sites (Borneo, Gabon, Congo (1,CNES), CCRS, Cameroun), no clear LANDSAT 8 images was available yet and we had to keep the LANDSAT 5 reference.
- It’s not too bad for Congo, CCRS et Cameroon, as LANDSAT 5 references where quite good, for Gabon, we used a reference made with the cloud free image obtained with SPOT4-Take5, and finally, we just have Borneo site for which the level 1C obtained are quite bad with large registration errors (I am sorry Jukka)
- A large enhancement of the performances has been observed for Sumatra, Gabon and Congo (2,ESA), for which the first version was quite bad.
- SPOT4 radiometric calibration updated
- A the end of SPOT4’s life, my CNES colleagues updated its absolute calibration. Spot calibration is obtained using desert sites, using another satellite as reference. Up to now, it was POLDER, but now it is MERIS/ENVISAT. Moreover, the calibration coefficients we used in the first version had been extrapolated from older measurements, while now recent measurements have been used. The differences are not too big, except for the near infra-red band which varied by 4%..
- The level 2A have been reprocessed with a new version of the aerosol model, with larger aerosols. The previous model had been tuned for sites in France, but we found that the larger particles fitted better the in situ data on all the sites.
- For users of mountain sites, we added a few flags about the correction of terrain effects. If the slope is in the shade, or nearly in the shade, the correction we have to do is infinite ! We limited the value of the correction and flagged the pixels for which we had to limit it in the .DIV files.
- And at last, the Maricopa site was finally processed. This site was acquired under two angles, one from the East, one from the West. It has therefore been observed twice every 5 days under different viewing angles. Such a case was not anticipated in our prototype, and we had to correct it. The site has been divided in 2 sites Maricopa_J1 for observations from the West, and Maricopa_J5 for observations from the East. This site, which benefits from New Mexico blue skies, is a very interesting one for remote sensing geeks, as it combines multi angular and multi-temporal observations at constant angles !

