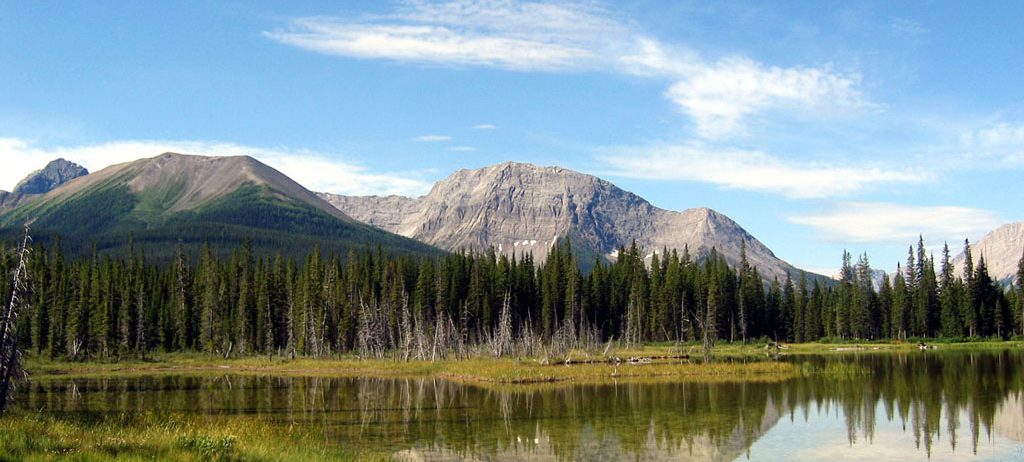
Snow cover duration in the Canadian Rockies from Sentinel-2 observations
Recently I generated one year of snow maps from Sentinel-2 in the Canadian Rockies for a talented colleague who is working on the numerical simulation of the snow cover at high-resolution with an exciting new hydrological model. The area is not covered by Theia, hence I used Start_Maja to generate the L2A products and then LIS to generate the snow masks on the CNES supercomputer (thanks!).
This area is quite challenging for snow optical remote sensing: the terrain is steep and there are a lot of forests. After processing this area, I also found some unexpected issues in the LIS processor, which need to be fixed, like turbid rivers detected as snow, or wildfires smoke detected as snow. I tried to use Pekel’s water mask to remove the rivers and lakes pixels but there are some glaciers that are misclassified as water in this product hence I simply masked out areas below 2000 m. This eliminates most of the water surfaces but not all the forests, hence I used Hansen’s global forest product to mask out pixels with a tree cover density larger than 50%.

With these snow products I computed a time series of cloud-free snow products by linear interpolation in the temporal dimension from 01 Mar 2018 to 01 Aug 2018 (154 days). From this stack I could compute the snow cover duration map, i.e. the number of days with snow for each pixel. This simple method provides an indicator that is similar but different to the « snow persistence » or « snow probability » i.e. for each pixel, the number of times that snow was observed divided by the number of clear-sky observations. The disadvantage of the « snow probability » is that it is weighted by the seasonal distribution of the cloud cover, therefore I prefer to work with the snow cover duration to reduce a time series of snow maps into a single map.
As a sanity check I often look if areas with high snow cover duration match the glacierized areas. Here I zoomed on Haig Glacier (50°43’N, 115°18’W) in Kananaskis Country and plotted the glaciers outlines from the Randolph Glacier Inventory 6.0:
As noted by Marshall (2014), « Haig Glacier is the largest outlet of a 3.3 km² ice field that straddles the North American continental divide », which means that melt water from Haig Glacier flows towards the Atlantic Ocean!
