Visualizing the vegetation dynamics in Africa

The Global Imagery Browse Services is an API provided by the NASA to access its vast collection of Earth Observation products.

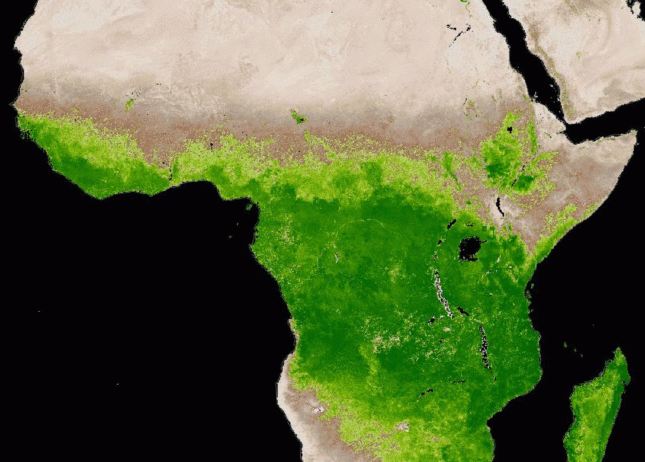
It’s convenient to use the Worldview online data browser to get the right URL template. Just click on « Take a snapshot » and copy the URL. For example the following URL allows you to download a jpeg picture of the Terra MODIS NDVI in December 2002 over Africa:

https://wvs.earthdata.nasa.gov/api/v1/snapshot?REQUEST=GetSnapshot&TIME=2002-12-01T00:00:00Z&BBOX=-36.03751831054688,-18.663024902343757,37.77621459960939,52.163305664062506&CRS=EPSG:4326&LAYERS=Coastlines,MODIS_Terra_L3_NDVI_Monthly&WRAP=x,day&FORMAT=image/jpeg&WIDTH=806&HEIGHT=840

By looping on the « TIME » parameter (in a bash script using wget) you can get every monthly products from 2001 to 2020, and make this animation ( using ffmpeg). The « & » symbol in the end of the line sends the download requests in parallel (don’t abuse of it).

for yy in $(seq 2001 2020)
do
  for mm in 01 02 03 04 05 06 07 08 09 10 11 12
  do
   wget "https://wvs.earthdata.nasa.gov/api/v1/snapshot?REQUEST=GetSnapshot&BBOX=-36.03751831054688,-18.663024902343757,37.77621459960939,52.163305664062506&CRS=EPSG:4326&LAYERS=Coastlines,MODIS_Terra_L3_NDVI_Monthly&WRAP=x,day&FORMAT=image/jpeg&WIDTH=806&HEIGHT=840&TIME=$yy-$mm-01T00:00:00Z" -O $yy-$mm.jpg &
  done
done


You can also download the images as Geotiff if you wish to combine them with other geospatial data.

Each layer comes with a specific colormap that is consistent with the product. In addition you can download a stack of multiple layers with different opacities, for example you can overlay the MODIS « fire » layer on the « NDVI » layer.

https://wvs.earthdata.nasa.gov/api/v1/snapshot?REQUEST=GetSnapshot&TIME=2002-12-01T00:00:00Z&BBOX=-36.03751831054688,-18.663024902343757,37.77621459960939,52.163305664062506&CRS=EPSG:4326&LAYERS=Coastlines,MODIS_Terra_L3_NDVI_Monthly,MODIS_Terra_Thermal_Anomalies_All&WRAP=x,day,none&FORMAT=image/jpeg&WIDTH=806&HEIGHT=840&ts=1611574112018

Note: this article was updated on 25 Jan 2021.


Plus d'actualités

New clear-sky image of the Rasuwa rock-ice avalanche

On 08 Sep 2026, Sentinel-2 acquired a clear-sky image near the release area of the landslide which caused the catastrophic flood in Nepal. Using this image and a pre-event digital elevation model (Berthier 2026) we can analyze the upper part of the avalanche runout profile. The block of rock and ice was released near 5120 […]

How long is the cooling effect of a cloud shadow ?

How long does it take for the cannon barrel to cool down after firing a shell ? Fernand Raynaud => This quote is from a famous old French funny sketch by Fernand Raynaud, which was based on a question in a French manual for soldiers: the sketch is rather long, so I’ll give you the […]

Impact of the August 12, 2026 eclipse on photovoltaic electricity generation in Spain

Photovoltaic (PV) energy supplies more 20% of Spain’s total electricity, and this share hit a new high in July 2026 (28.3% of the nation’s monthly electricity mix). Some media outlets were concerned about the drop in photovoltaic power generation during the 12-Aug-2026 eclipse. Le Monde explained that « the drop is expected to be particularly pronounced […]

Rechercher