Mapping flooded areas using Sentinel-1 in Google Earth Engine
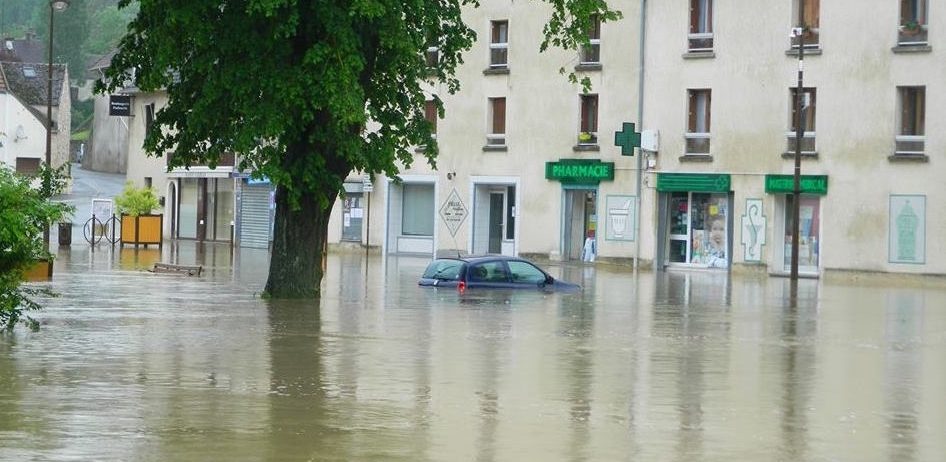
Exceptional rainfall in May caused heavy flooding in the Paris region. Newspapers and TVs reported that the Seine flood forced the Louvre staff to move away from rising waters the art pieces that were stored in their cellar. But they did not tell you that about 50 km east of the Louvre museum, the flood of the Grand Morin river in Coulommiers also inundated the cellar of my parents-in-law. I’m really concerned about this cellar because I care about my parents-in-law of course, and also because I have let some of my bottles of wine in their cellar.
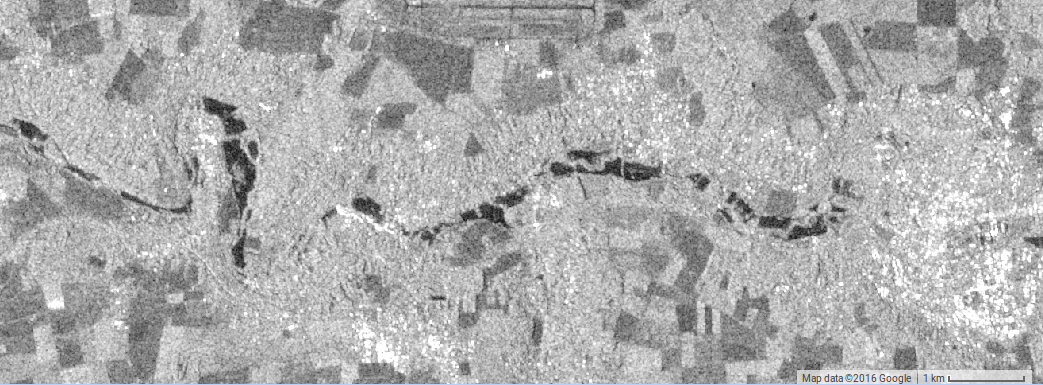
The theory tells us that the backscatter intensity received by a radar satellite drops over flooded soil because the emitted electromagnetic waves are specularly reflected off the water surface and thus does not return to the antenna (see e.g. slide 86 of this course on Radar Measurements by Chris Allen). In forest areas the opposite happens because reflections from the water surface will hit the trunks and canopy and thus enhance backscatter.
I used a simple demonstration script provided by the Google Earth Engine team to see if I can map flooded areas based on Sentinel-1 data. The algorithm takes two Sentinel-1 images that were pre-processed to backscatter coefficient in decibels after thermal noise removal, radiometric calibration and terrain correction.
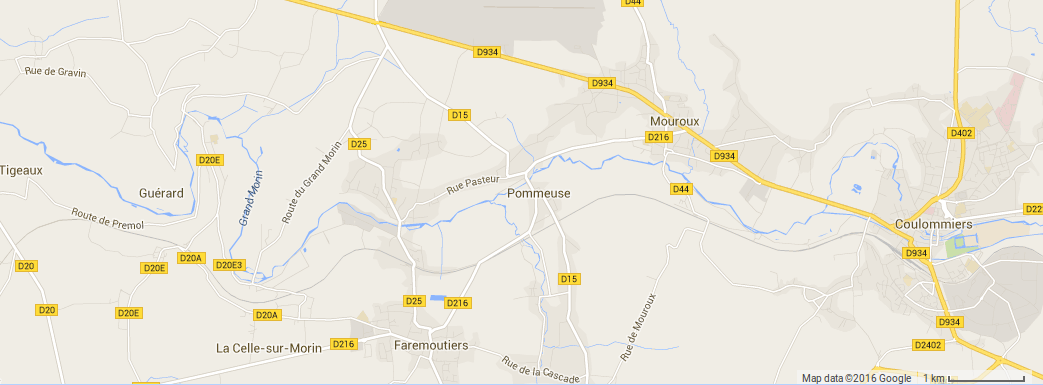
This is the study area : the villages along the Grand Morin river near Coulommiers city are the most exposed to flooding in the area (click to zoom):
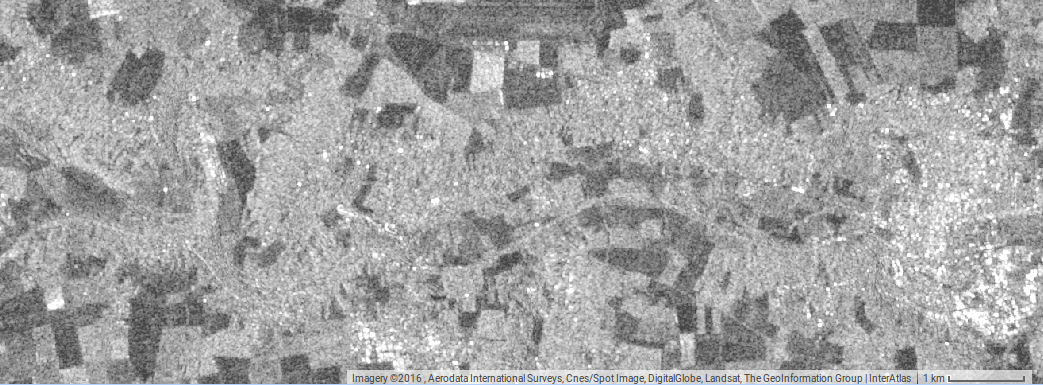
 This S1 image acquired on 14-May-2016 can be used as a reference image « before flooding »:
 Luckily there is an S1 image acquired on 31-May-2016 when the flood reached its maximum in the area (my mother-in-law, personal communication).
 The script computes the difference between both images and then applies a smoothing filter to reduce the effect of the speckle noise.
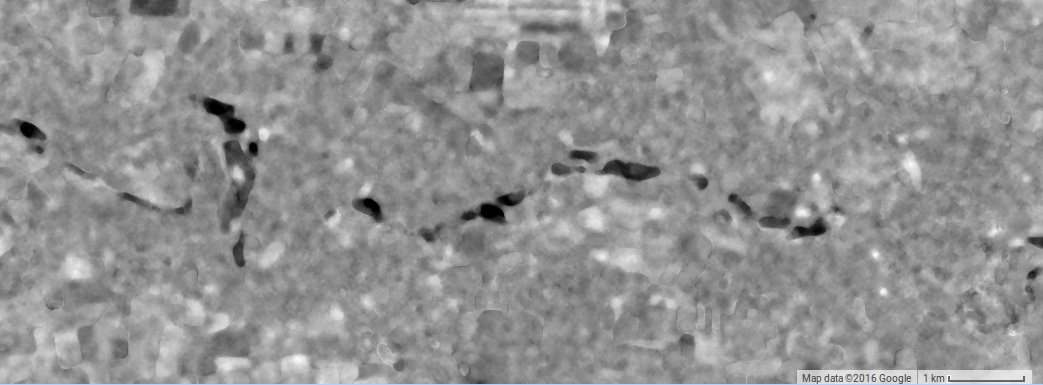 Then this smoothed image is thresholded to identify potential « flooded » areas
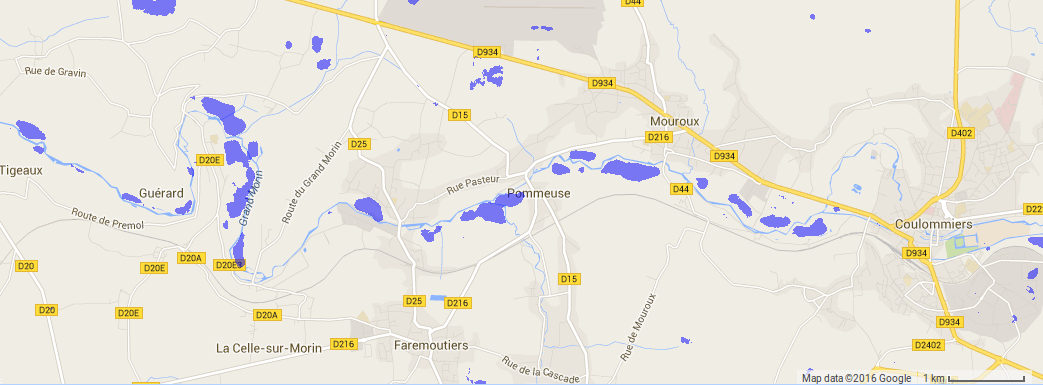 The same map with the « satellite » image as background:
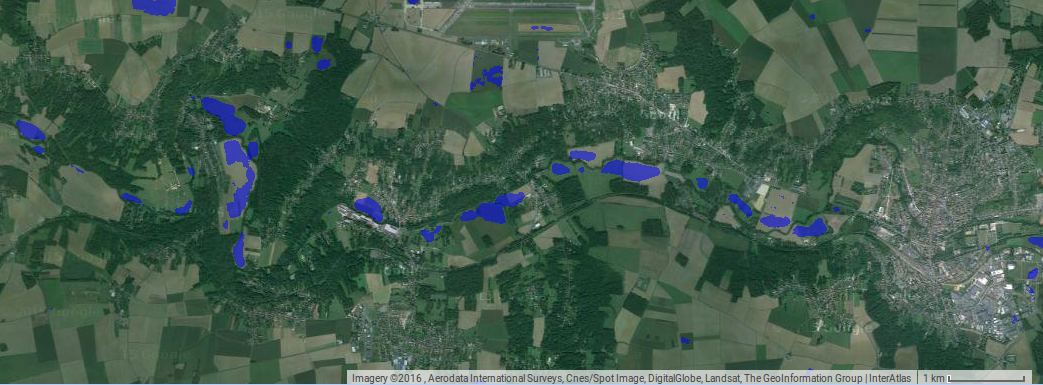 It shows that the largest differences between both S1 images are located in the meanders near the Grand Morin river, in open areas (without forest), which seems very plausible. I did not find good validation data, only some hints from the local newspaper « Le Pays Briard » that Pommeuse was severely hit by the flood..

I’m a newbie in radar remote sensing. These maps may be wrong, or at least taken with caution. If you are looking for accurate flood detection maps you should rather have a look to Copernicus Emergency website. There are many professional flood maps generated by the SERTIT using Sentinel-1, Radarsat-2 and Pléiades… I always thought that using radar imagery could be a very cumbersome process. Google Earth Engine was a great tool to overcome this idea. I wish space agencies provide a similar service. In the meantime… Deal with the devil?
The GEE script below generates the maps presented above
// Load Sentinel-1 images to map Seine-et-Marne flooding, France, May-June 2016.
// This script was originally written by Simon Ilyushchenko (GEE team)

// Default location
var pt = ee.Geometry.Point(3.02,48.82);
// Grand Morin near Coulommiers

// Load Sentinel-1 C-band SAR Ground Range collection (log scaling, VV co-polar)
var collection = ee.ImageCollection('COPERNICUS/S1_GRD')
.filterBounds(pt)
.filter(ee.Filter.listContains('transmitterReceiverPolarisation', 'VV'))
.select('VV');

// Filter by date
var before = collection.filterDate('2016-05-01', '2016-05-17').mosaic();
var after = collection.filterDate('2016-05-30', '2016-06-01').mosaic();

// Threshold smoothed radar intensities to identify "flooded" areas.
var SMOOTHING_RADIUS = 100;
var DIFF_UPPER_THRESHOLD = -3;
var diff_smoothed = after.focal_median(SMOOTHING_RADIUS, 'circle', 'meters')
.subtract(before.focal_median(SMOOTHING_RADIUS, 'circle', 'meters'));
var diff_thresholded = diff_smoothed.lt(DIFF_UPPER_THRESHOLD);

// Display map

Map.centerObject(pt, 13);
Map.addLayer(before, {min:-30,max:0}, 'Before flood');
Map.addLayer(after, {min:-30,max:0}, 'After flood');
Map.addLayer(after.subtract(before), {min:-10,max:10}, 'After - before', 0);
Map.addLayer(diff_smoothed, {min:-10,max:10}, 'diff smoothed', 0);
Map.addLayer(diff_thresholded.updateMask(diff_thresholded, {palette:"0000FF"},'flooded areas - blue',1);
Nota bene: I deliberately choose the simplest method to illustrate this post although we have tried a lot of different filters and options with my colleague Michel Le Page. For instance one can mask out slopes that are greater than 5 degrees using the hydroSHEDS digital elevation model:
var hydrosheds = ee.Image('WWF/HydroSHEDS/03VFDEM');
var terrain = ee.Algorithms.Terrain(hydrosheds);
var slope = terrain.select('slope');
before = before.mask(slope.lt(5));
after = after.mask(slope.lt(5));
You may also want to select only descending orbits:
var before = collection.filterDate('2016-05-15', '2016-05-22')
.filter(ee.Filter.eq('orbitProperties_pass', 'DESCENDING'))
.mosaic();
etc…, etc…