Is DS 4 EO BS?
EO, RS, GS, DS, AI, ML, DL, BS, WTF?
Everybody in the Geosciences (GS) and Remote Sensing (RS) community is now aware of the great advances in Data Science (DS) and Machine Learning (ML) that have taken place in the last 10 years. Although many people talk about Deep Learning (DL) or Artificial Intelligence (AI), these terms don’t usually accurately describe the techniques used in our field. If we want to be pedantic, we may say that:
- most of the neural networks used are not really deep;
- machine learning techniques other than artificial neural networks (ANN) like for instance Random Forests, Gradient Boosting Trees and similar techniques scale better for some problems and are still the first choice for operational applications;
- most of the approaches in AI are not used anymore (search algorithms, constraint satisfaction problems, logical agents, etc.), so using the term AI is not appropriate;
- other techniques are on the rise to cope with the limitations of ANNs (evolutionary approaches to build neural architectures, probabilistic programming to model uncertainty), so speaking about DL is too narrow.
I like to use the term Data Science, because it encompasses not only the techniques used, but also how they are deployed and, most importantly, the domain problem that one wants to solve. In figure 1 we see that DS is at the intersection of the domain expertise (i.e. hydrology, agronomy, geology, ecology), mathematical modeling (statistics, optimization) and computer science (automation, scalability).
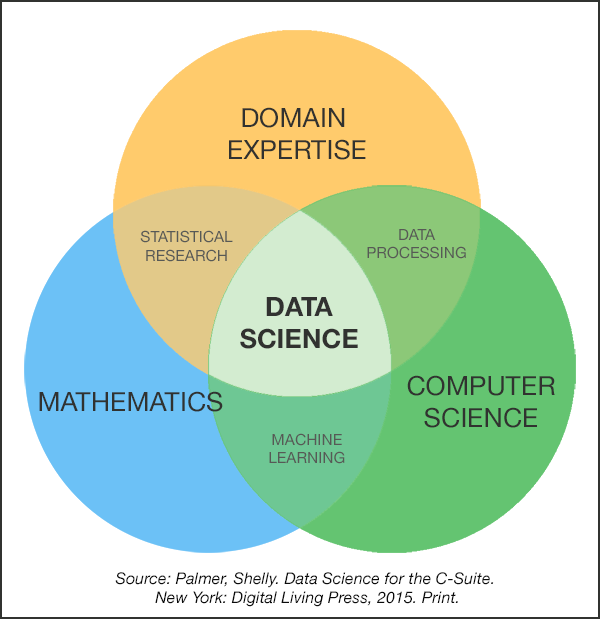
Figure 1: The Venn diagram of Data Science (from http://www.datascienceassn.org)
In Earth Observation (EO) problems and more generally in the Geosciences, this point of view is very useful.
It is interesting to understand that classical science falls at the intersection of the domain expertise and the mathematical modeling, where for instance, a simple regression can be used to calibrate the parameters of a model. The data processing done by data centers and ground segments is at the intersection of the domain expertise (the scientist writes the ATBD1 which is then coded as processing chains that operate on massive data). Machine Learning can be seen as scaling the mathematical models through massive computation exploiting large volumes of data.
So let’s try to understand if DS for EO is really BS (Latin for Bulbus Stercum2).
Good buzz, bad buzz
The sad fact is that there is a lack of nuance in the discussion about these topics: either DS is great, or it is BS. The cynical in me would say that this is due to the fact that nowadays too many discussions take place on Twitter (where flame wars are legion) or LinkedIn (where everybody loves everybody’s work) and also because researchers are forced to act like startup founders: work on an elevator pitch for a funding agency who has no technical knowledge and thinks ROI3.
But beyond Twitter and desperate research grant proposals, there are publications in peer reviewed journals that may give the impression that we are missing the point in terms of the problems we are trying to solve with these techniques.
I will try illustrate this with 3 examples. My goal here is not to make fun of these specific cases. There is surely serious work behind these examples, but the fact is that, as presented, they may leave a suspicious impression to an attentive reader.
- Cropland parcel delineation
Automatically delineating agricultural parcels is a difficult task. In a prestigious conference publication [1], the authors claim that their ML model
[…] automatically generates closed geometries without any heavy post-processing. When tested with satellite imagery from Denmark, this tailored model correctly predicts field boundaries with an overall accuracy of 0.79. Besides, it demonstrates a robust knowledge generalization with positive results over different geographies, as it gets an overall accuracy of 0.71 when used over areas in France.
If we don’t pay attention to the numbers, this statement can be understood as if the problem was solved and an operational product was available. Looking at the numbers we understand that there is between 20% and 30% error. For a product which is meant to replace the Land Parcel Information System (LPIS) for which the annual changes are less than 5%, we understand that we are far from the goal. Furthermore, the visual results in figure 2 show that the cartographic quality of the objects is low: the fields are blobby, many boundaries are missed, etc.
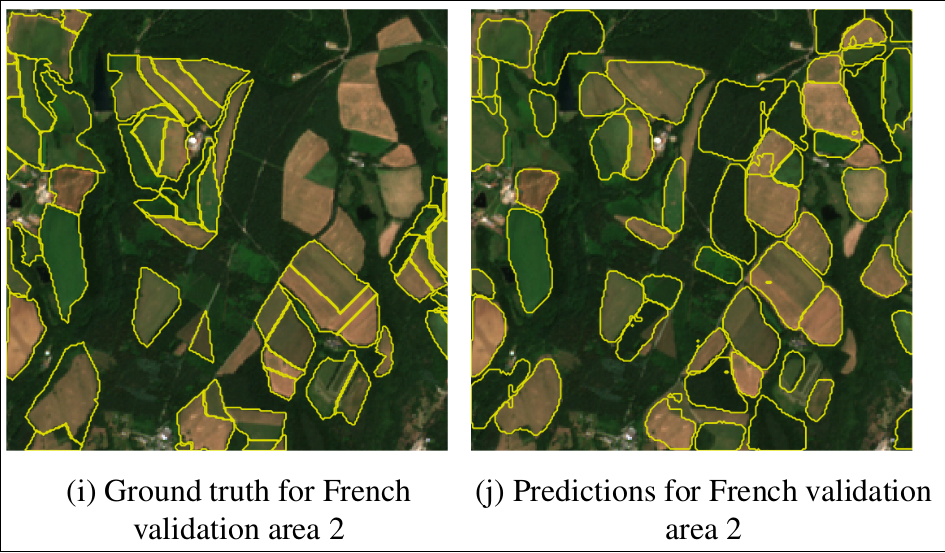
Figure 2: Example of cropland parcel delineation (from [1])
I chose this example because we have tried to reproduce this results at CESBIO, and despite having a very skilled intern and, of course, great supervision, we had a hard time. The feedback on this work was reported in this post.
Maybe the mistake here was using approaches that may be suited to multimedia data, where the level of expected accuracy is way lower than for cartographic products. Also, sometimes we are hammers looking for a nail: we forget (or don’t have the domain expertise) that some problems may be better solved using other data sources than satellite imagery alone: in countries where the parcels are beautiful polygons, starting from scratch is a pity, because the most recent LPIS is usually a very good first guess.
- SAR to optical image translation
Using the all-weather capabilities of Synthetic Aperture Radar to fill the gaps due to clouds or even completely replace optical imagery is a goal that has been tracked for a long time. In the recent years, many works using the latest techniques in DL have been published. These techniques reuse approaches that have been developed for image synthesis in domains like multimedia or video games.
If we take one recent example [2], we can read:
The powerful performance of Generative Adversarial Networks (GANs) in image-to-image
translation has been well demonstrated in recent years.
[…]
The superiority of our algorithm is also demonstrated by being applied to different networks.However, when we have a look at the images (see figure 3) we see that reflectance levels can be very different between the real optical image and the translated one.
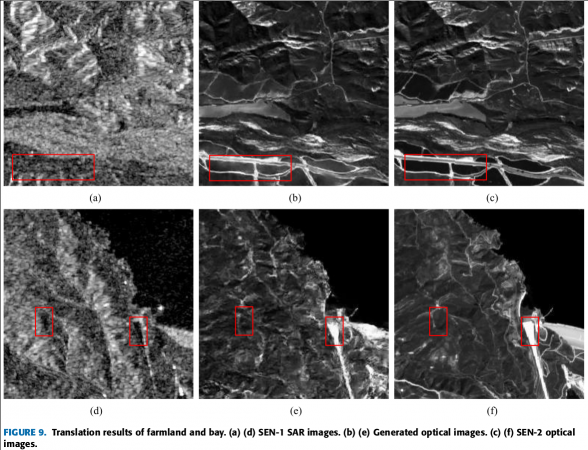
Figure 3: Illustration of SAR to optical image translation (from [2])
It is of course impressive that the algorithm is able to generate a plausible image: if we did not have the real optical image, we could think that the result is a good one. The problem here is that, in Remote Sensing, we don’t deal with pictures, we deal with physical measures which have a physical meaning. For most applications, we don’t want plausible images (these generative methods produce data that follow the same statistical distribution as the training data): we need the most likely image together with uncertainty estimates.
- Image super-resolution
Another nice obsession of image processing folks is super-resolution: transforming the images acquired by a satellite to a version where the pixels are smaller and fine details are visible. For a long time, the super-resolution approaches were based on sound mathematical tools from the signal processing toolbox. A nice thing with our signal processing expert friends is that they had objective quality measures and they also used to assess the algorithms by expert photo-interpreters.
In recent times, the trend has been towards using learning algorithms: use a pair of images of the same area, one at high resolution and the other at low resolution and train a model to do the super-resolution. The publications on the topic are galore and we have even companies which aim to provide this kind of data. For instance, in a recent LinkedIn post by SkyCues one could read:
THE ONLY SOURCE FOR HIGH-RESOLUTION SATELLITE IMAGERY covering the entire world, updating every few days based on a consolidated source of coherent, dependable and secure earth observation data Now at 1m and improved color correctness
[…]
Dear EO Colleagues: we are Swiss-based EO innovation, where we managed to produce decent quality 1m from Sentinel-2 (see image). This employ very deep Machine Learning trained globally.Exploring the publicly available data, one can evaluate the quality of the results. Figure 4 shows an illustration of artifacts present in these super-resolved images.
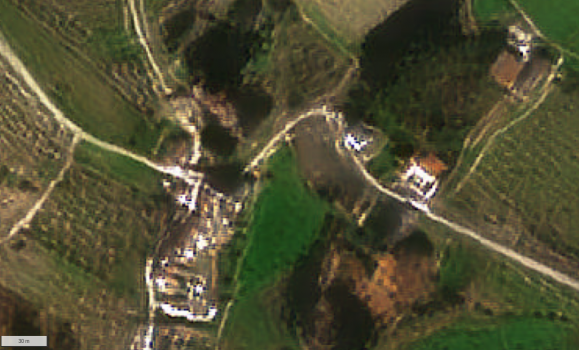
Figure 4: Illustration of Sentinel-2 super-resolution (from https://explore.skycues.com/)
There may be some applications for which this kind of data is useful, but for many others, this quality is not acceptable and is certainly equivalent to (or worse than) the data already available through some small satellites with very low image quality standards.
- Many other examples
I will stress again that the choice of examples above is anecdotal. Many more could be cited. I have seen papers or attended to presentations about very puzzling things, like for instance (just to name a few):
- trying to detect clouds on Sentinel-2 images by using the visible bands only (no cirrus band, no multi-temporal information);
- training a DL algorithm to reproduce the results of a classical algorithm «because we did not have real reference data»;
- doing data augmentation4 on VHR SAR images by applying rotations (the SAR acquisition geometry effects like layover, foreshortening or shadowing do not make any sense after rotation);
Also, with the goal of building corpora of data on which algorithms could be benchmarked, many data sets have been proposed to the RS and ML communities. Most of these data sets are not representative of real problems with the specificities of remote sensing data. Some of them contain only the 3 visible bands of a satellite having many more, or do not contain any temporal information when they are supposed to be useful for land cover classification.
Others, are not well designed from the machine learning point of view. For instance the data set for the TiSeLaC contest had pixels in the training set which were neighbors of pixels in the test set. It is not surprising that the algorithm that won the competition only used the pixel coordinates and discarded the spectro-temporal information!
Why all this BS and how to avoid it?
Again, remember that I am using the Latin word only to troll, among other things because I guess one could find papers with similar issues with my name on them.
- Why bother about all this?
The issue here is not fraud or dishonesty from those who write or publish the things I highlighted above. After all, most of these publications go through a peer review process … The real problem here comes from those who extrapolate the consequences of these results.
It would be a real problem if someone decided to reduce the revisit of an optical constellation «because we can get the same data from SAR images, anyway».
It is also difficult to explain to users that a country-scale land cover map can’t have 99% accuracy like the results shown in the last CNN-GAN-Transformer paper they have seen on Twitter.
All these issues need detailed analysis, good validation and, most of all, real understanding of how things work in terms of physics, math and software. And here is the bad news: it takes time, hard work and collaboration.
- A unicorn is a team
If we go back to the Venn diagram of DS, we can identify some danger zones. Figure 5 illustrates those (although it should be adapted to our field, but I am too lazy).
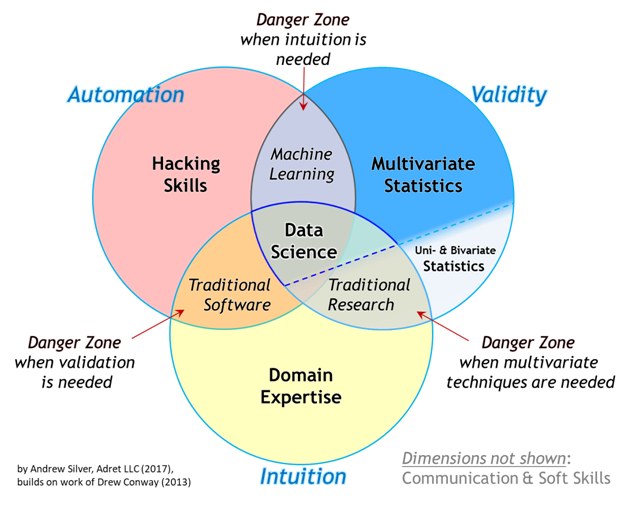
Figure 5: Danger zones in DS (from https://www.kdnuggets.com)
- Domain knowledge and automation without mathematical rigor lead to unproven or wrong results: for example, a regression model assumes that the soil moisture data are Gaussian when they are not.
- Domain knowledge and mathematical modeling without the automation to large data can lead to biased results. It seems that there was a scientist that spent their whole career calibrating the same model for every new study site.
- And most problematic, ML (math + CS) without the domain knowledge can lead to daft approaches that do not solve any problem. This is when we take the latest DL model trained to detect cats and use it for leaf area index estimation, because the tensors have the same dimensions and the code was available on Github.
A way to avoid this is to ensure that the work is supported by the 3 pillars of DS. If you are reading this, you may lay somewhere in the Venn diagram. Being at the center is rare, these are unicorns [3]. However, a team can have a center of mass that gravitates towards the intersection of the 3 pillars. At CESBIO, we are lucky to have that. When my code is crap and won’t scale, Julien tells me so and helps me improve it. Mathieu is there to remind me that I need to shuffle the training data correctly for stochastic gradient descent to be efficient. Olivier is happy to explain to me for the nth time that, yes, reflectances can be greater than 1. There you go: automation, math and domain knowledge.
This 3-sided reality check can be sometimes frustrating in the publish or perish world we live in. We can also give the impression of being Dr. Know-it-all when we review papers (or write this kind of post!).
- Where best leverage DL?
We can conclude that DS is not BS, but the buzz about ML in general, and recently DL in particular, and their uses without domain knowledge, may have created a negative impression.
If we abandon the DL all the things motto and are pragmatic, we can say that DL approaches are just universal function approximators that can be calibrated by optimizing a cost function. If the problem at hand can be posed as a cost function, either in terms of fit to a reference data set (supervised inference learning), or in terms of the properties of the function output (unsupervised generative models), chances are that DL can be applied.
Without wanting to give an agenda of AI research for the Geosciences (others have already done it [4]), we can identify the kinds of problems for which these techniques could be useful.
There are of course the classical problems for which ML has been used for decades now: land cover classification and biophysical parameter estimation. But one may wonder if replacing RF by DL to maybe gain 1% in accuracy while increasing the computation cost is worth it.
For these applications problems, it may be more interesting to guide the learning approaches by the physics of the problem.
Complex physical models can’t be run over large geographical areas because of computational costs. The alternative has usually been to use simpler, less accurate models when going from a small study area to a large region. Since neural networks are universal approximators, they can be used to replace the complex physical model and run with a fraction of the computational cost.
For some of the applications illustrated above (super-resolution, multi-sensor fusion) DL can be a pertinent solution, but the cost functions and the network architectures can’t just be copied from other domains. The domain knowledge of the RS expert (the sensor characteristics for super-resolution, the physics of the signal and the observed processes for multi-sensor fusion) can be translated in terms of cost functions to optimize or latent variables of the model.
But maybe we also have to question when DL is not the appropriate solution. One of the criticisms that one can make to many recent papers in peer reviewed journals is that they lack to check the performances of simple, straightforward solutions. Many DL papers benchmark DL algorithms between them but forget to compare to a simple regression, or a Random Forest. Simplicity of the models (for explainability and for energy consumption) should always be a criterion when proposing a new algorithm. Let’s not forget that in the Geosciences we want to produce information that helps to advance knowledge. Using the coolest tool may not be the real goal.
Footnotes:
Algorithm Theoretical Basis Document
Return On Investment, not Region Of Interest on your study area!
A technique used to generate lots of training data from a smaller data set