INFERNO: a new software processing radar interferometry time series using Sentinel 1 products
The applications of interferometric techniques on radar images are currently developing in many fields. Being able to easily process and plot radar images, interferograms or time series of interferograms with a tool and data that are free and available without being a specialist is an important issue for scientists or companies that do not want or cannot invest in techniques that are usually heavy and complex. The Inferno software has been developed for this purpose.
Inferno is not infernal!
The method used by Inferno is known and validated. The tool has been deliberately designed to be as simple as possible to use. Even if other similar tools exist on the market, they are more general and complex.
The limitation to one type of satellite data (Sentinel 1) and to non-modular filtering possibilities allows us to simplify the use of the tool without degrading the performances. Moreover, the outputs are processed / visualized with external tools chosen and mastered by the user, such as QGIS or others.
The spatial data used are those of the Copernicus Sentinel-1 satellite, which has a temporal revisit of about 6 to 12 days over most of the world’s landmass.
For 30 years, the Radar Processing Department of the CNES Technical Directorate has been one of the forerunners in the field of radar interferometry and has developed processing chains in this field. From these basic building blocks, the Inferno tool was developed for CNES by Thales Services.
The development was carried out as part of a business study activity for the CNES LabOT (https://eolab.cnes.fr). The objective of the LabOT is to promote the emergence of new applications implementing an Earth Observation component.
It is available as open source on the CNES github: https://github.com/CNES/inferno , and as a linux and windows docker.
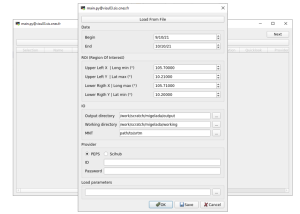
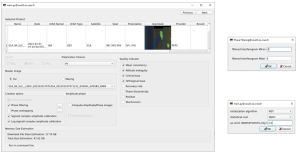
The tool consists of an Interface, where one specifies the dates, the area of interest and the software automatically downloads the necessary data, using a Scihub Copernicus (https://scihub.copernicus.eu/) or PEPS (https://peps.cnes.fr/rocket/) account. We also need a digital terrain model like SRTM, downloadable for those who do not have access to CNES datalake.
This software is an operational chain that allows to automate the treatments developed before:
– on one hand, the code to retrieve and process time series of radar images on given geographical areas (S1-tiling)
– on the other hand, to perform interferometric processing on pairs of images (before / after a given event) (slideOTB based on the OTB library). Knowing that a prototyping of the chaining of the two tools has already been done before the study (TimeSerieSLC).
How it works
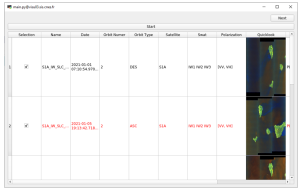
4 typical scenarios are proposed:
– Scenario 1: Choice of the same orbit and the same satellite if the selected area is contained on a single image.
– Scenario 2 : Choice of successive images with the same orbit and the same satellite if the selected area is on two successive images.
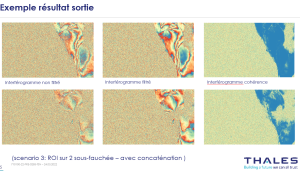
– Scenario 3 : Choice of images with the same satellite or not following the same type of orbit (ascending or descending) if the selected area is on two sub-drafts of the same image.
– Scenario 4: Choice of the maximum number of successive images in the specified time interval.
Once the scenario is chosen, a window allows you to choose processing and output options:
– Choice of the selected VV and/or VH polarizations.
– Generation of reference images in amplitude and phase.
– Calibration of the output interferograms.
– Output data filtering (speckle reducing averaging)
– Orthorectification of the output images on the Sentinel2 MGRS grid.
– Phase unwinding with the external module Snaphu.
– Calculation of a number of parameters defining the geometry and quality of the interferograms.
Results
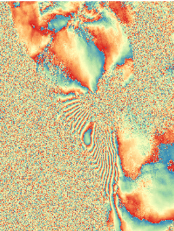
The final products of INFERNO are the interferograms, images with 3 channels:
– Average amplitude in power of the initial images.
– Difference of phase between the images: the difference of phase is directly related to a displacement of the ground between the successive catches of sight: It can be translated in term of displacement by the use of an external module Snaphu of unfolding of the fringes.
– Coherence: For each pixel, value between 0 and 1 determining the quality of the interferogram.
The outputs are then processed / visualized with tools chosen by the user. Comparisons of the quality of the results obtained have to be compared with those obtained by the GDM-SAR service carried by DataTerra/Formater, we will inform you here.
This tool is now available to all. Feedback, criticism, comments from users for its improvement are of course welcome.
Contacts
Denis CARBONNE, denis.carbonne@cnes.fr
Christelle ILIOPOULOS, christelle.iliopoulos@cnes.fr
Damien MIGEL ARACHCHIGE, damien.migel-arachchige@thalesgroup.com