Improvement of high cloud detection in MAJA for Sentinel-2 images.
![]() =>
=> ![]() The research to improve the performances of our MAJA atmospheric correction processor relies on a very small team within CESBIO, with two persons, Bastien Rouquié, who is working at improving aerosol retrievals, and myself, who spend most of the time in meetings, or writing blog posts, and sometimes doing both simultaneously ;). This is why improvements take time.
The research to improve the performances of our MAJA atmospheric correction processor relies on a very small team within CESBIO, with two persons, Bastien Rouquié, who is working at improving aerosol retrievals, and myself, who spend most of the time in meetings, or writing blog posts, and sometimes doing both simultaneously ;). This is why improvements take time.
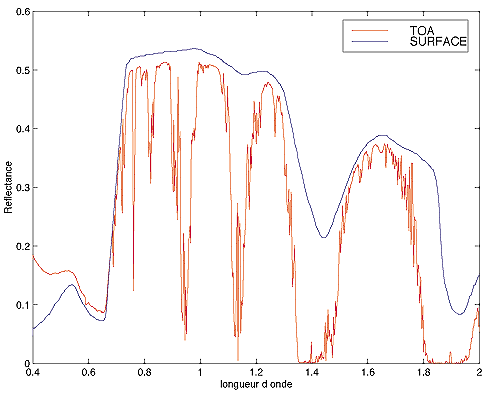
Anyway, I recently found some time to work on improving cloud masks above water. And these last days, i worked at improving the detection of high cloud using the cirrus band, which is available on Sentinel-2 as well as Landsat 8. As explained in this post, the « cirrus » band is locates in a strong absorption band of water vapour, strong enough to prevent photons from going from the sun to the satellite via the earth surface at sea level. As most of the water vapour lies in the low layers of the atmosphere, the clouds situated higher in the atmosphere have more chances to reflect light to the satellite. As a result, this channel allows us to detect the high clouds. The detection method looks simple : just use a threshold on the cirrus band. Well that’s not that easy !
Mountains can also be above the absorbing layer and send light to the satellite. We have to account for earth surface altitude to detect cirrus clouds. Even if theory suggests an exponential law, we have been using so far a threshold that varies linearly with the altitude. We therefore need to determine the offset and gain of the linear law :
Threshold= S0 + G*h
To tune these values, one needs two steps. First determining the value of S0 using images in low altitude, and then determining the gain on images with higher altitude. Of course, you need to process hundred of images on different sites and different dates to accumulate different surface reflectance and atmospheric conditions.
The plot provided below shows our new threshold law, and compares it to samples of cirrus and cloud free observations from 6 different images, with and without clouds, from three sites, one at law altitude, near Toulouse (S2 tilename = 31TCJ), and two in altitude, on the high plateaux of Madagascar (S2 tilename is 38KPC) and on Atlas mountains in Morocco (S2 tilename is 29RPQ). The data set in this plot is just illustrative of the complexity of the detection.
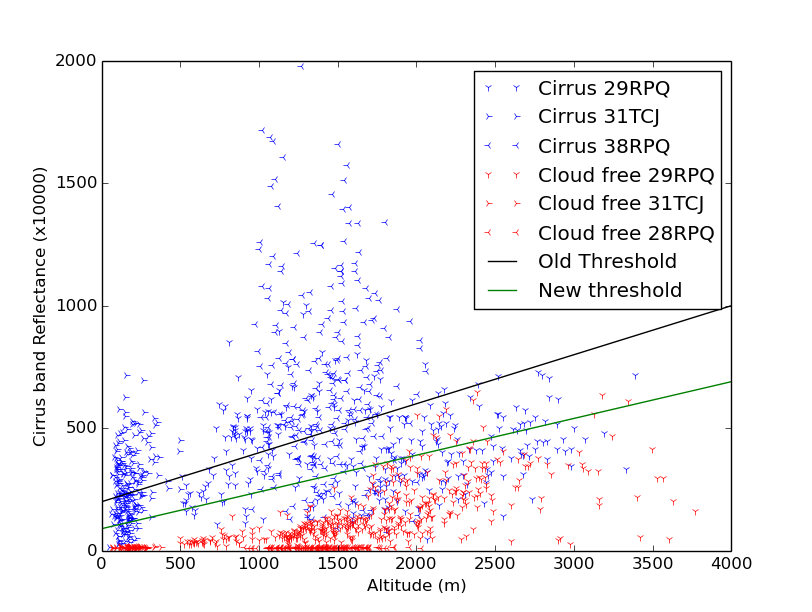
The new thresholding will be included in version 1.6 of the products delivered by Theia, in a couple of weeks. The previous threshold law had been set to prevent classifying as clouds dry altitude regions, but had the drawback to miss detection of thin cirrus clouds. On the contrary, the new threshold will detect more clouds, but also sometimes classify high altitude regions with a dry atmosphere as clouds. This is what we observe in the following example, over Atlas, on a dry day :
 Old cirrus threshold |
 New cirrus threshold |
We still can hope that these bright regions with a dry air are not often cloudy, and that only the driest dates will be wrongly classified as clouds. This case excepted, the new threshold improves the detection of thin clouds. For instance for this other date over Atlas.
 Old cirrus threshold Old cirrus threshold |  New cirrus threshold New cirrus threshold |
Or maybe over that date in Madagascar :
 Old cirrus threshold Old cirrus threshold |  New cirrus threshold New cirrus threshold |
Really good observers will notice that we are still missing the thinnest parts of the cirrus clouds, but that’s the price to pay not to declare as cloudy the dry mountains. MAJA cloud detection does not only rely on the cirrus bands and several other tests can also detect the thin clouds. Some of you might also have noticed on the above plot the detection threshold of cirrus clouds could be lower to discard more of the blue cloud markers. However, some of the blue symbols were sampled on the image below (left, the cirrus band reflectance coded between 0 and 0.02). Cirrus clouds are present, but they do not disturb the values in the other channels. It would therefore be a pity to advise users not to use these pixels by classifying them as clouds. As I said, high cloud detection with the cirrus band is not that easy !
 B10 band B10 band |  New cirrus threshold New cirrus threshold |