Global sea ice area : a scary plot

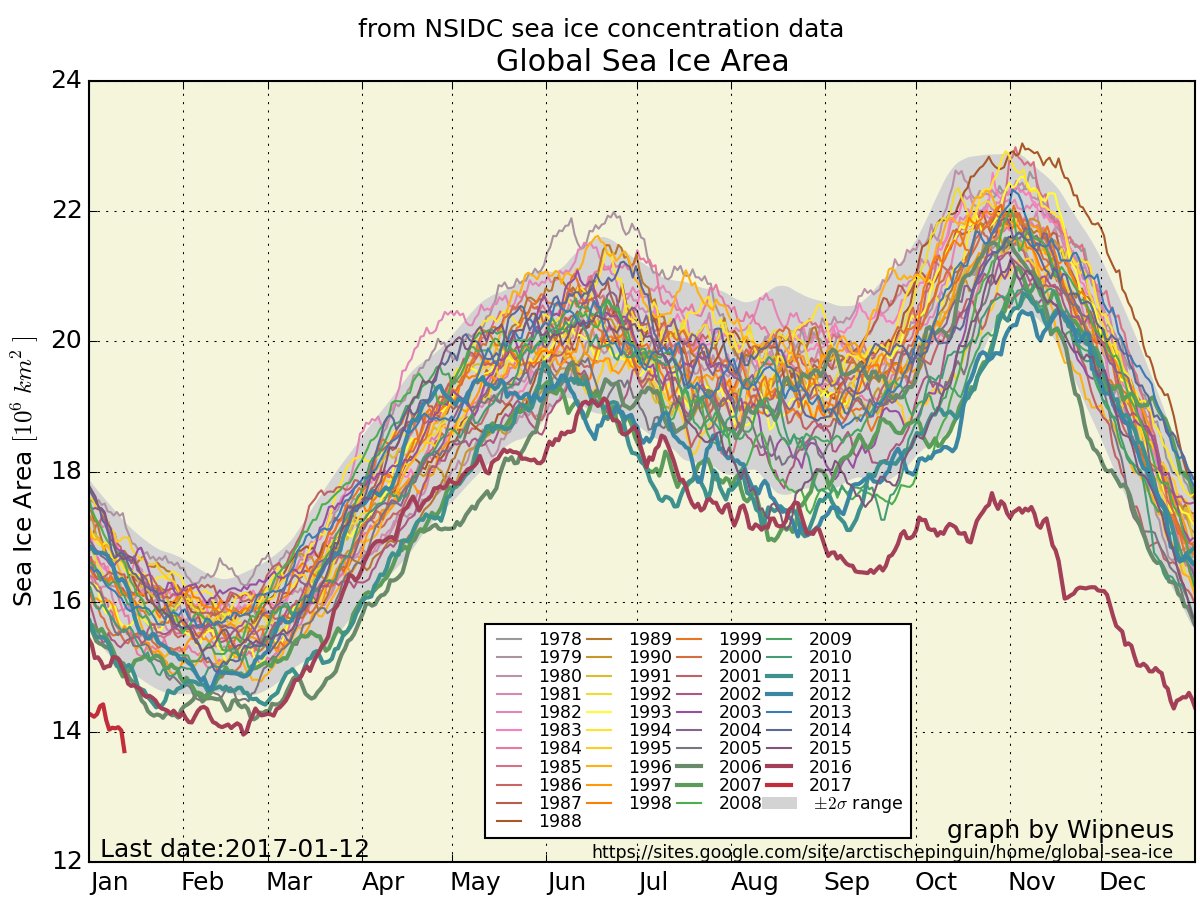
When I say « a scary plot », I don’t mean a Chinese plot aimed at confusing some naive North Americans, it just mean a figure (an American one, by the way, made with data from the National Snow and Ice Data Center) that provides the total sea ice area over the globe. And this figure is scary :

The red curve corresponds to last year’s sea ice area.

Let’s hope it is partly due to the el-niño phenomenon we had last year, and that next years will come closer to the average curves. However, as a cold wave is about to reach western Europe, let’s record it for later !

Plus d'actualités

BIOMASS, the third launched satellite mission designed at CESBIO !

After SMOS in 2009, and VENµS in 2017, the CESBIO Laboratory is very proud to see its third proposed mission, Biomass, reach orbit. As always, it has been a long journey from the idea, at the beginning of the century, to the selection in 2013 as the seventh Earth Explorer Mission by ESA, to the […]

Evolution de l’altitude de la ligne de neige au cours des 41 dernières années dans le bassin versant du Vénéon (Oisans)

Pour contribuer à caractériser les conditions hydrométéorologiques lors de la crue torrentielle qui a frappé la Bérarde en juin, j’ai analysé une nouvelle série de cartes d’enneigement qui couvre la période 1984-2024 [1]. Grâce à la profondeur temporelle de cette série, on constate que l’altitude de la ligne de neige dans le bassin versant du […]

Biophysical parameter retrieval from Sentinel-2 images using physics-driven deep learning for PROSAIL inversion

The results presented here are based on published work: Y. Zérah, S. Valero, and J. Inglada. « Physics-constrained deep learning for biophysical parameter retrieval from sentinel-2 images: Inversion of the prosail model« , in Remote Sensing of Environment, doi: 10.1016/j.rse.2024.114309. This work is part of the PhD of Yoël Zérah, supervised by Jordi Inglada and Silvia Valero. […]

Rechercher