[Directional effects] Effects of crop orientation on surface reflectance
Introduction
In the framework of our research for ESA concerning the maximum field of view of next generation of Sentinel-2 satellite, we searched for a way to estimate directional effects, without using a particular directional model to correct for these effects. The current directional models are imperfect, and we can assume that progress will be made in the coming years. We did not want to get a result that would depend on the directional model correction that we use in the study.
We tested two ideas: until which maximum viewing, can we correct BDRF effects
- with the Roy et al model, which assumes all types of bare soil or vegetation covers have similar directional effects
- without knowing the type of vegetation cover which is observed, but depending on no directional model
- knowing the type of crop, and even its development stage, but with no knowledge on the orientation of the crop
The items 1 and 2 have been studied in this article, while item 3 is the subject of this post. Well, as you will see in the results, this criterion did not deliver the results we expected, but this is what is interesting.
Simulations
For this, using the DART 3D radiative transfer model[1], Nicolas Lauret simulated 4 types of vegetation covers, a forest, corn, wheat and a vineyard. Corn and wheat were simulated at three development stages, and different ground reflectances were used. The number of simulated reflectances almost reached 1 million !
| Orange Grove | Wheat | Maize | Grapevine | |
| Growth stage | 1 | 3 | 3 | 1 |
| Grounds | 1 | 2 | 2 | 3 |
| Sun zenith | 7 | 7 | 7 | 7 |
| Scene Orientations | 18 | 18 | 18 | 18 |
| Nb of simulations | 126 | 756 | 756 | 378 |
| View zenith | 25 | 25 | 25 | 25 |
| View azimuth | 18 | 18 | 18 | 18 |
| Nb of simulated reflectances | 54558 | 327348 | 327348 | 163674 |
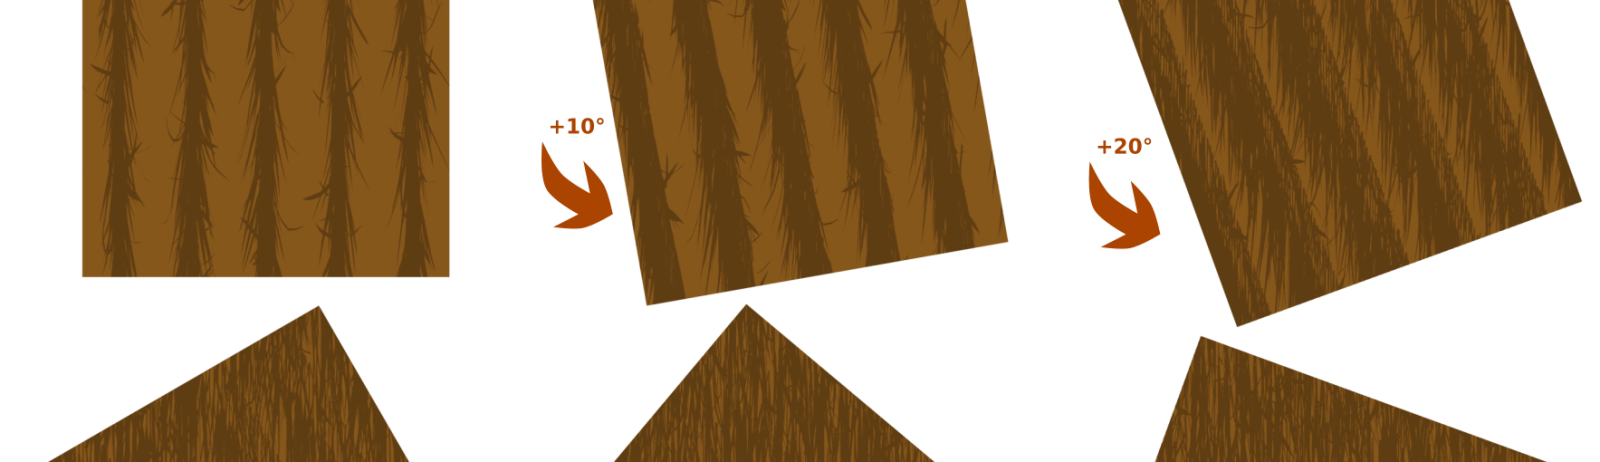
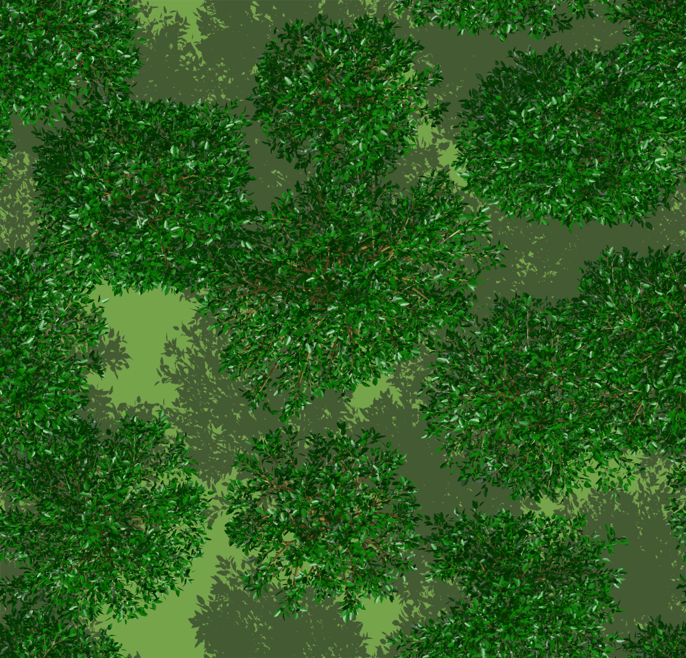
Here are a few view of the 3D mock ups we used as input of DART images. These images are then replicated infinitely on each side.
 Orange grove Orange grove | 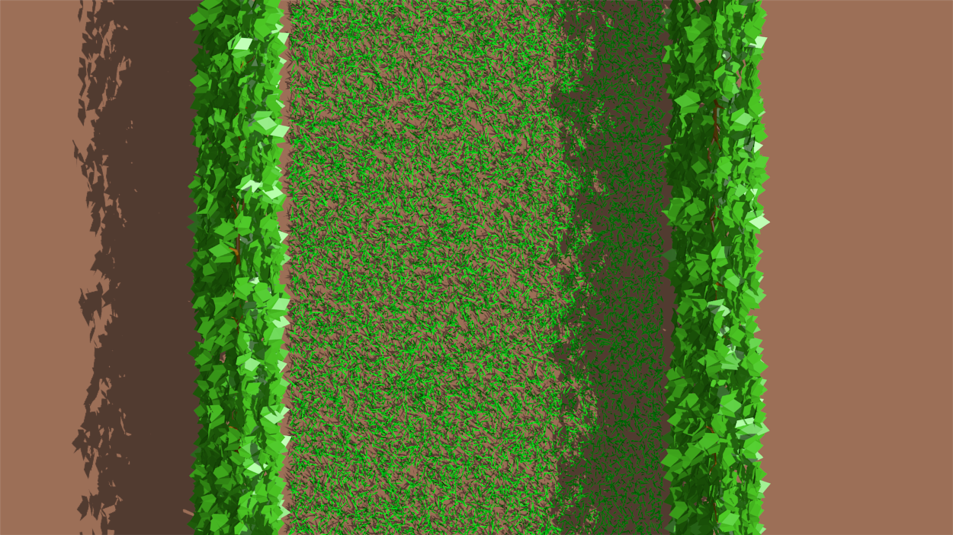 Vineyard Vineyard |
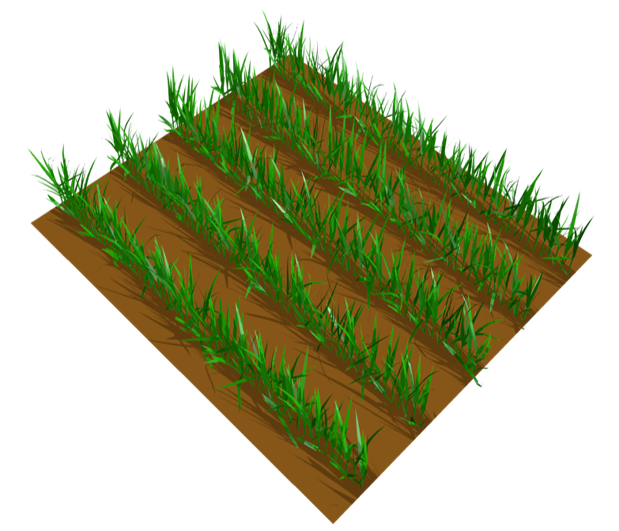 Wheat (early stage) Wheat (early stage) |
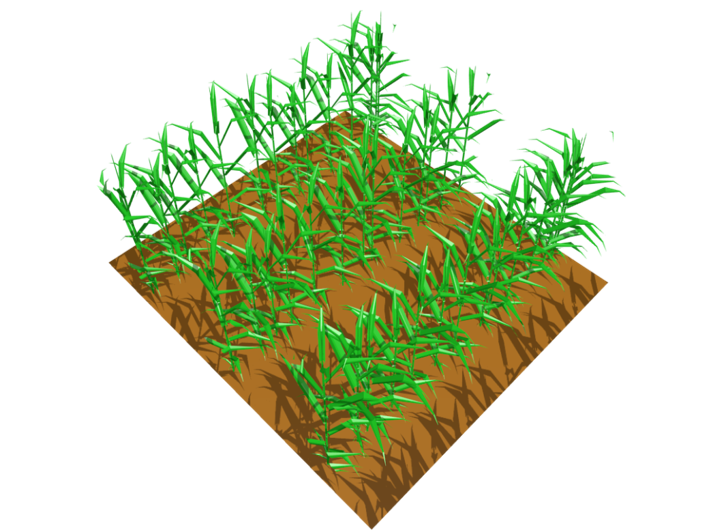 Maize (early stage) |
The orange grove has no rows, it will serve as a reference to compare with the other cover crops.
Results
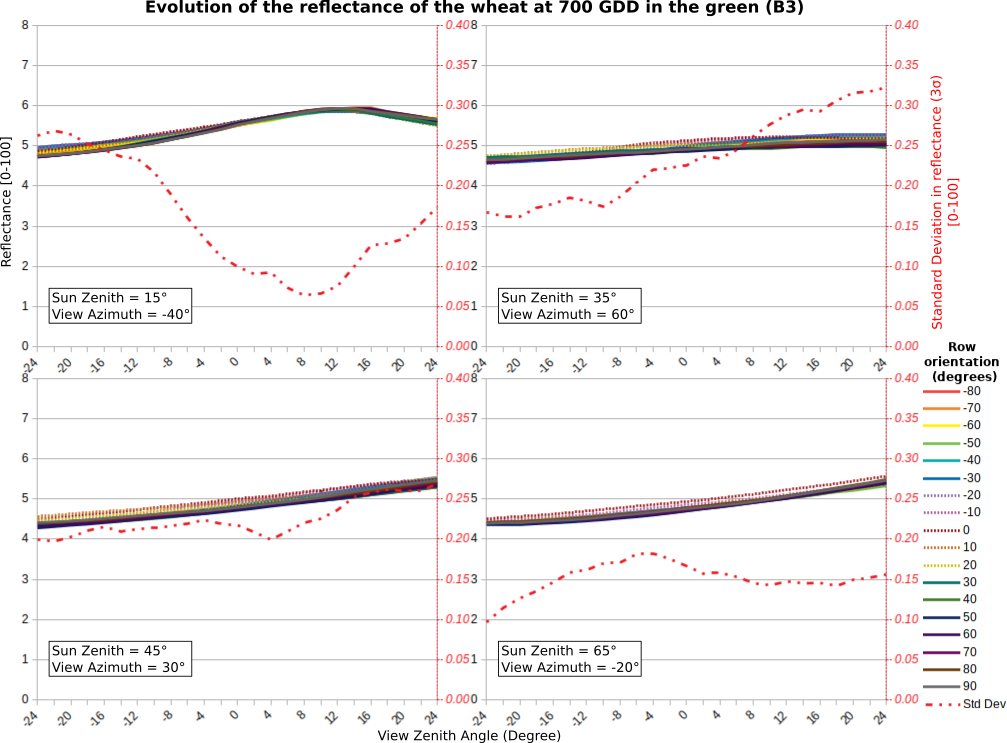
Here are some of the results we obtained with DART for all these cases. We only show here the results for the green band of Sentinel-2, but the results in the red band are similar, and those of the NIR and SWIR bands show even greater variations.
 Orange grove Orange grove | 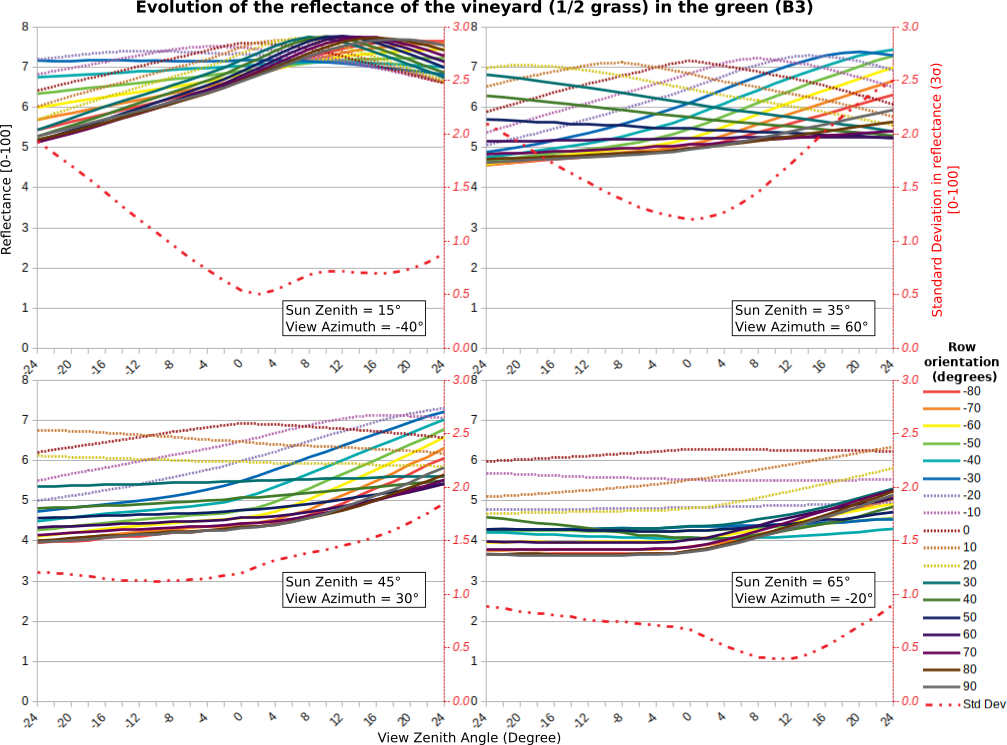 Vineyard Vineyard |
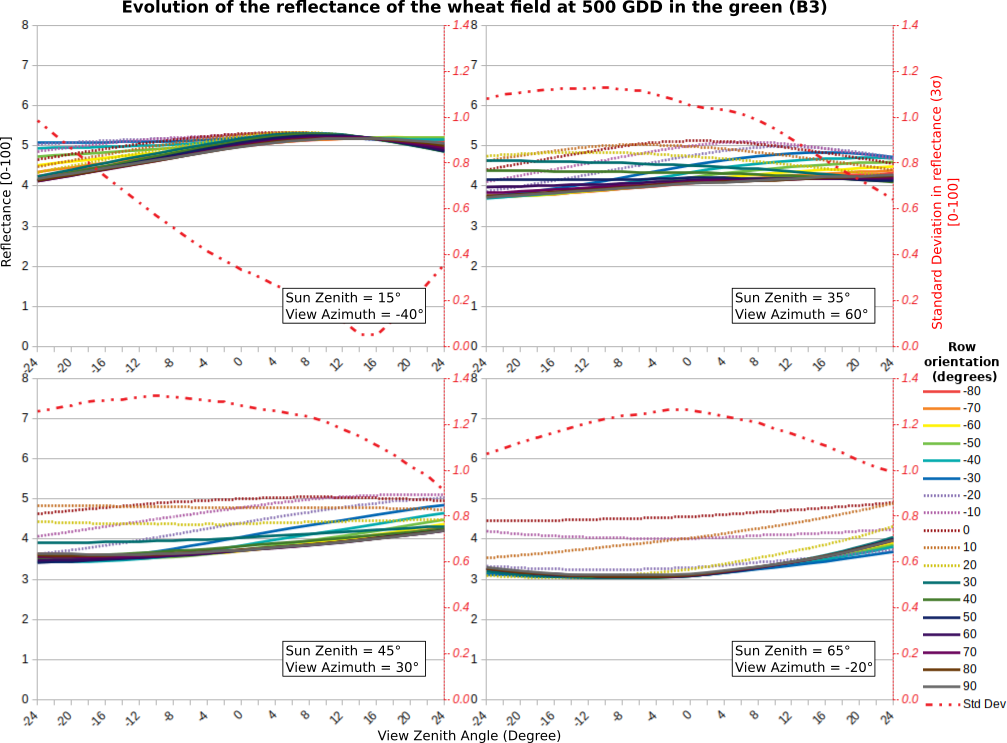 Wheat (early stage) Wheat (early stage) |
Wheat (medium stage) |
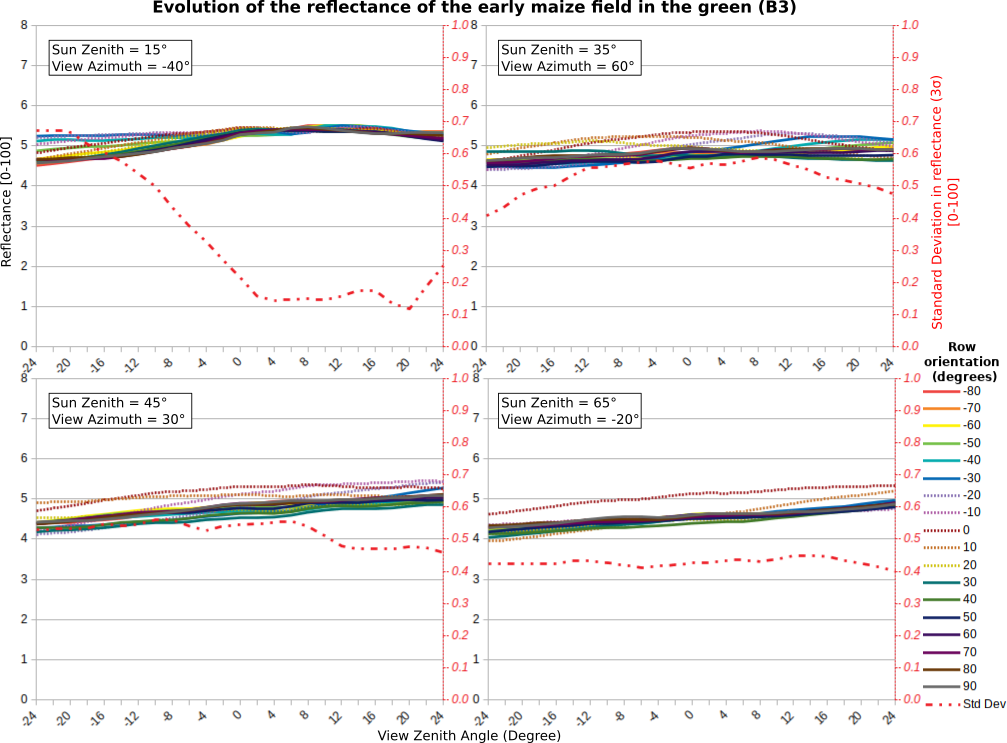
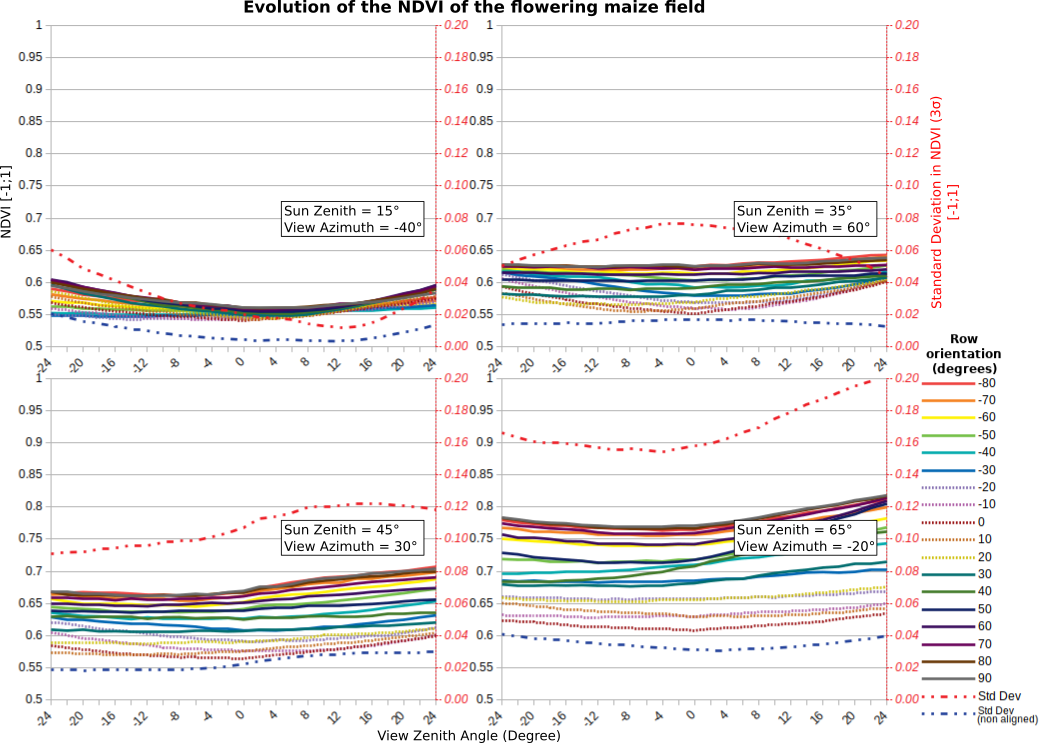
Maize (early stage) |
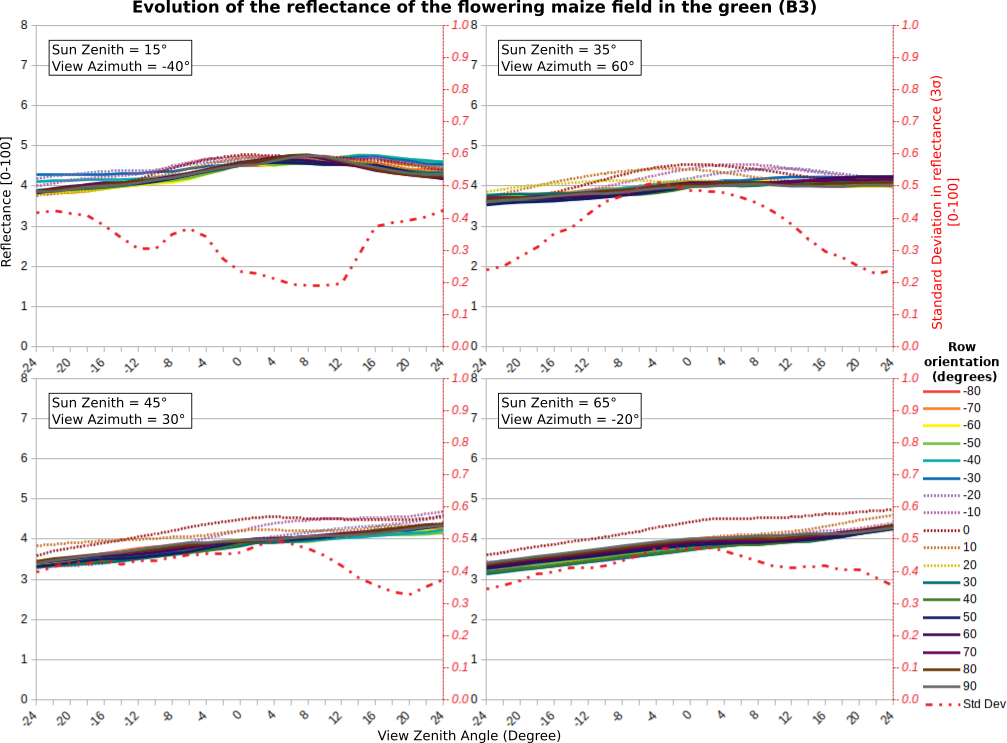 Maize (medium stage) |
All these figures show the variation of surface reflectance in the green band, as a function of the orientation of the rows (the color of the plots). The X axis is the zenith viewing angle, with positive values in the backscattering direction and negative values in the forward direction. Reflectances are expressed in %. The dashed red line corresponds to 3 times the standard deviation of the reflectance variation as a function of orientation for a given viewing angle. The orientation of 0° corresponds to the case when the sun direction and the rows are aligned.
What stroke us at first is the fact that the orientation of rows has already a large effect even at nadir (View zenith angle=0). The orientations close to the sun direction (from -20° to +20°) often provide results which differ from the other orientations. This is explained by the next figure, which shows the position of shadows for a Maize field as a function of orientation (the Sun direction is to the North in these graphs.
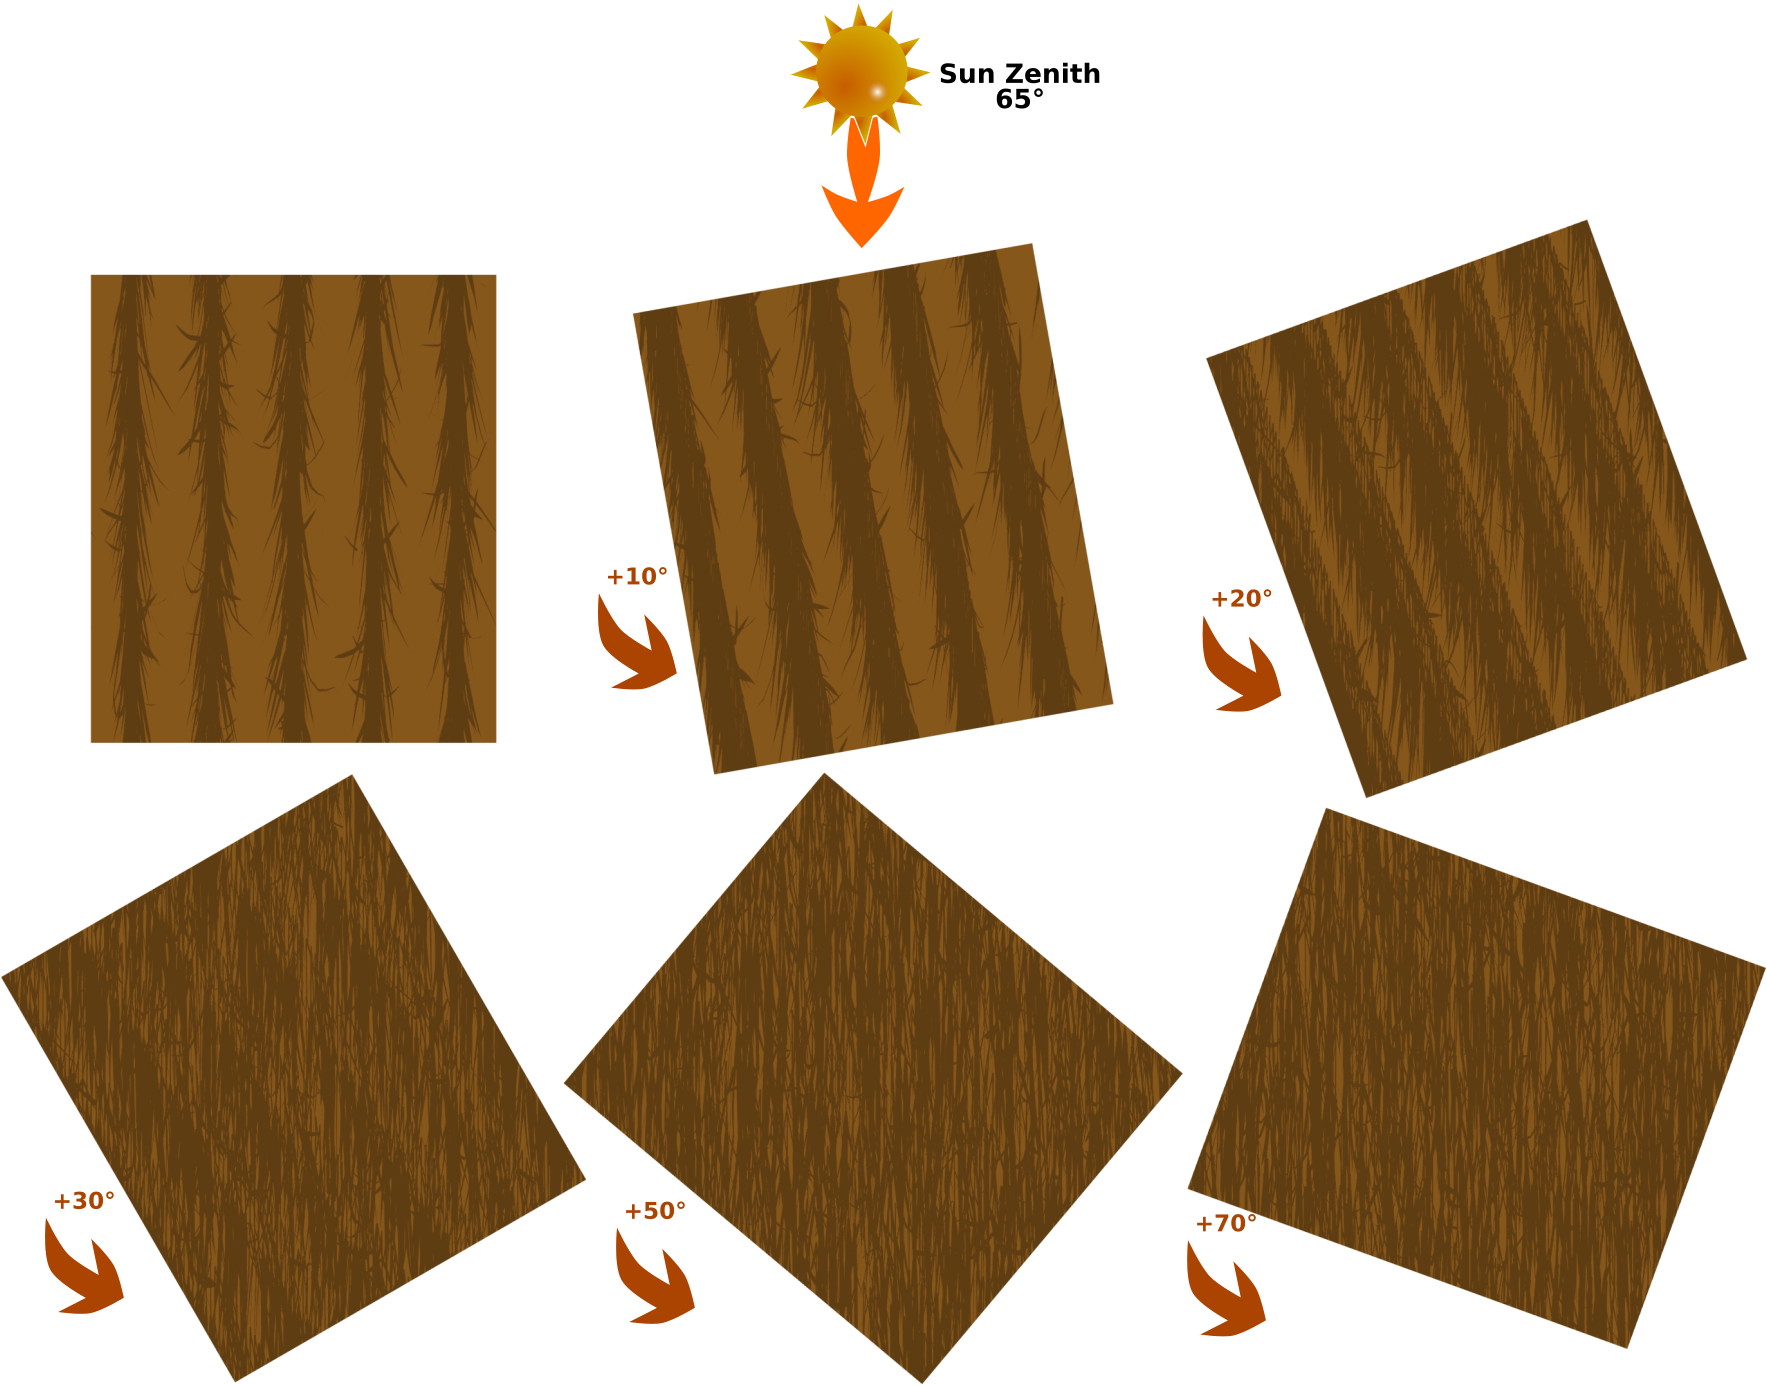
This explanation sounds logical when we are aware of this effect, but I have not seen it much mentioned in the literature (although a few papers have already addressed the effects of rows orientation ([2] and [3] ). These effects are quite large, sometimes greater than 10% on reflectance in relative, and have also effects on the NDVI.
 Effects of orientation on NDVI for a vineyard Effects of orientation on NDVI for a vineyard | 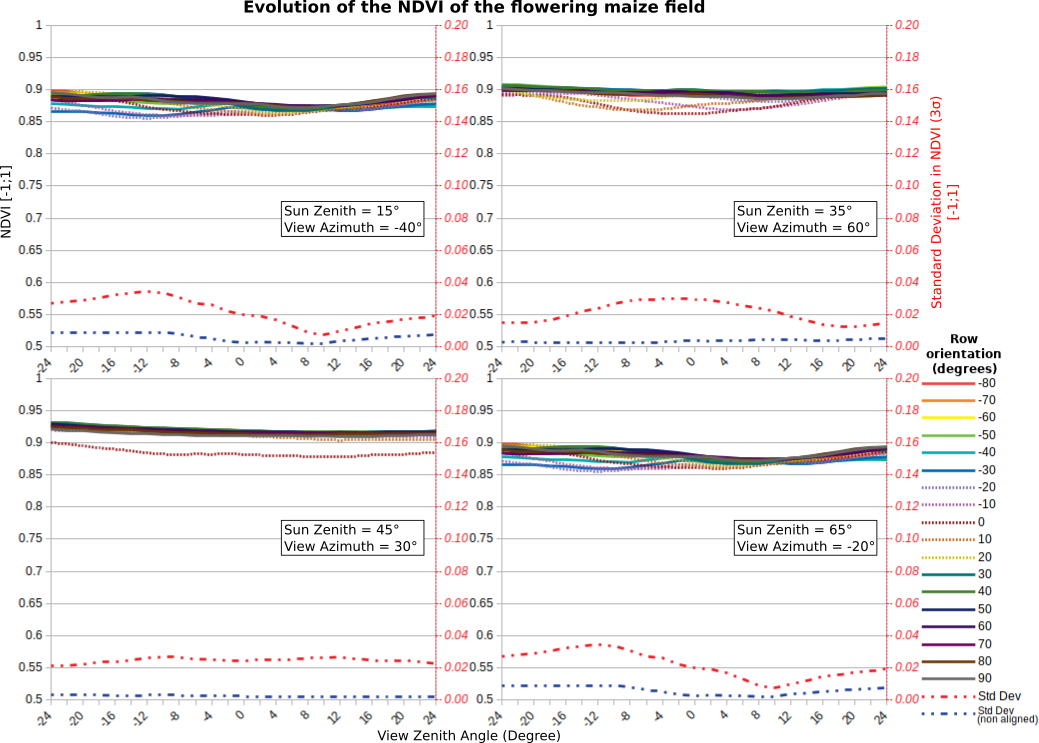 Effects of row orientation on Maize at medium stage (not the worst case) |
For the vineyard at least, but also for crops at early stages, users should be aware that they need to know the orientation of rows before trying to invert biophysical variables such as leaf area index. This result is consistent with what was observed on Venµs data over vineyards.
References
[1] Gastellu-Etchegorry J.P., Lauret N., Yin T., Landier L., Kallel A., Malenovský Z., Al Bitar A., Aval J., Benhmida S., Qi J., Medjdoub G., Guilleux J., Chavanon E., Cook B., Morton D., Nektarios N., Mitraka Z. DART: recent advances in remote sensing data modeling with atmosphere, polarization, and chlorophyll fluorescence. IEEE JSTARS, 10(6), 2640-49. 2017.
[2] Meggio, Franco & Zarco-Tejada, Pablo & Miller, John & Martín, P. & González, M.R. & Berjón, Alberto. (2008). Row Orientation and Viewing Geometry Effects on Row-structured Crops for Chlorophyll Content Estimation. Canadian Journal of Remote Sensing. 34. 220-234. 10.5589/m08-023.
[3] Kuester, T.; Spengler, D. Structural and Spectral Analysis of Cereal Canopy Reflectance and Reflectance Anisotropy. Remote Sens. 2018, 10, 1767.