
A dark cloud over Kiev on the 9th of June
 =>
=>  These days, Mireille Huc is spending a lot of time to enhance the cloud shadow detection method applied to time series. Our MACCS method tends to forget some shadows when they are partly hidden under the cloud. We will explain in a future article the defects of the present method and how we will mitigate them. When checking our results, we found out a very particular case, on June the 9th in 2015, on the time series acquired near Kiev with SPOT5 (Take5). The images are shown below :


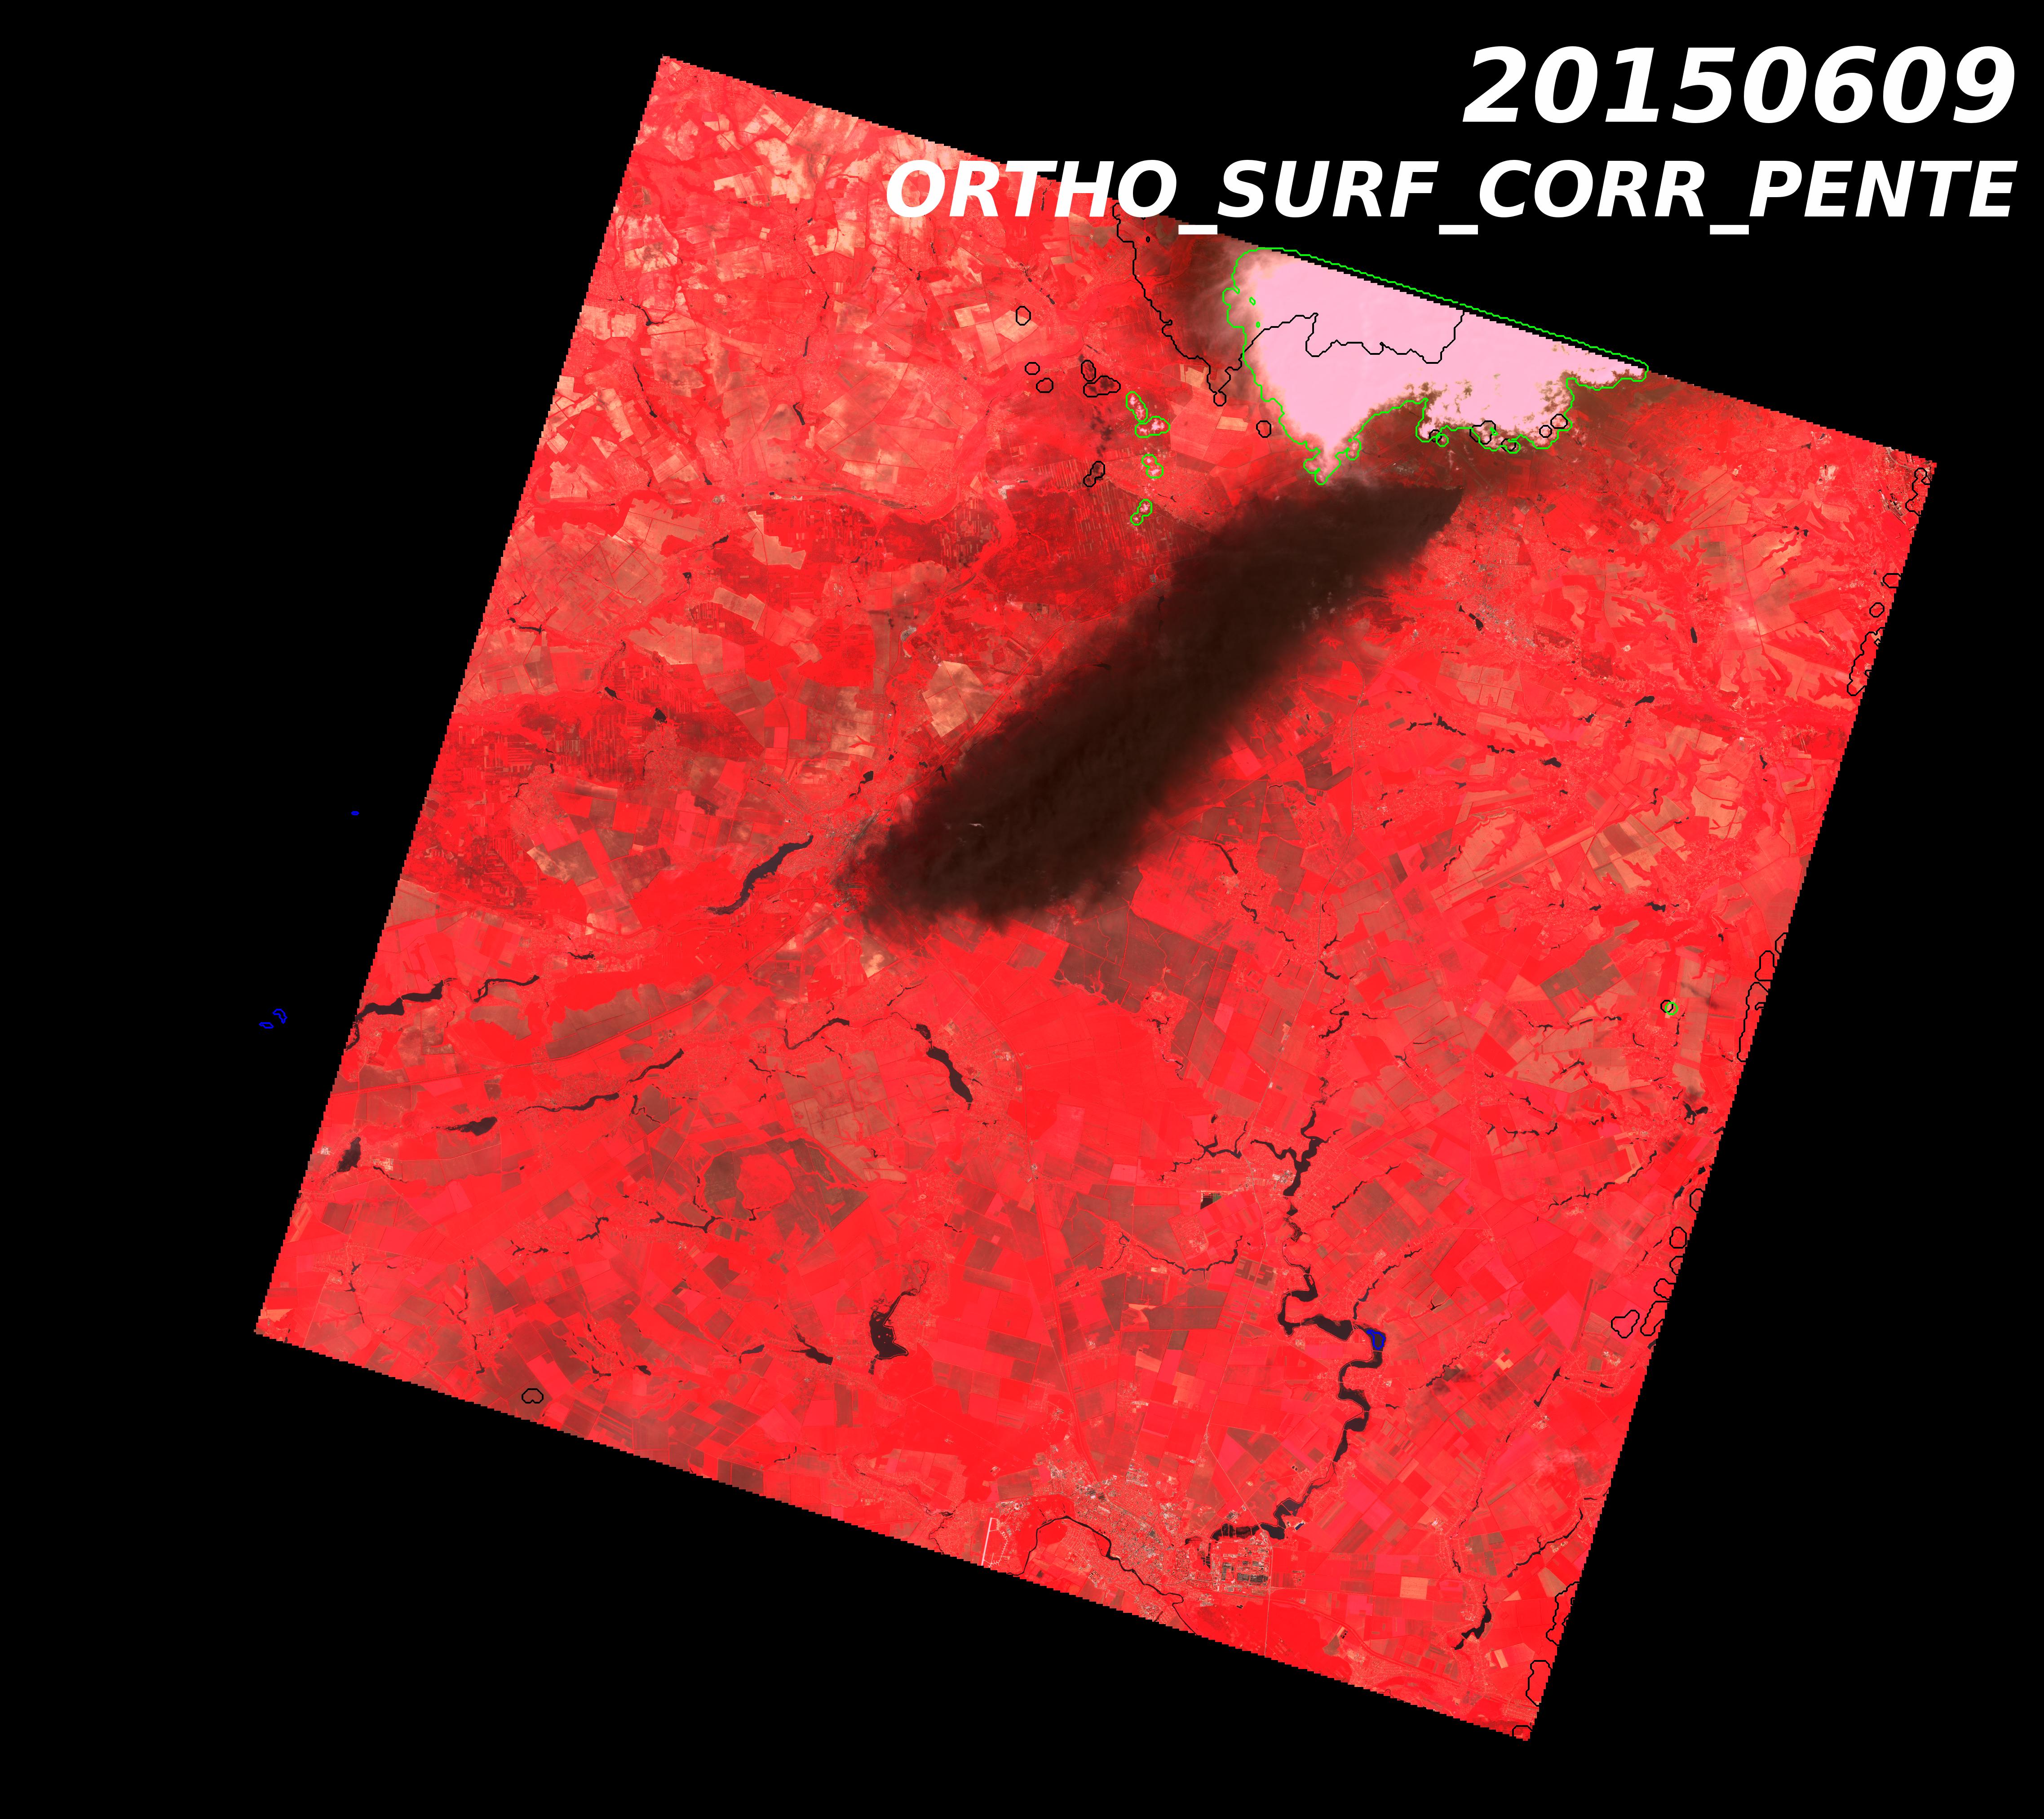
The dark zone in the image center was not classified as a cloud shadow, as shown by the quicklook. Because it is not a cloud shadow, the sun is in the South-East direction, and the shadows are cast to the North-West. It does not look like the footprint of a flooding, or of a forest fire, and there was no solar eclipse on that day…
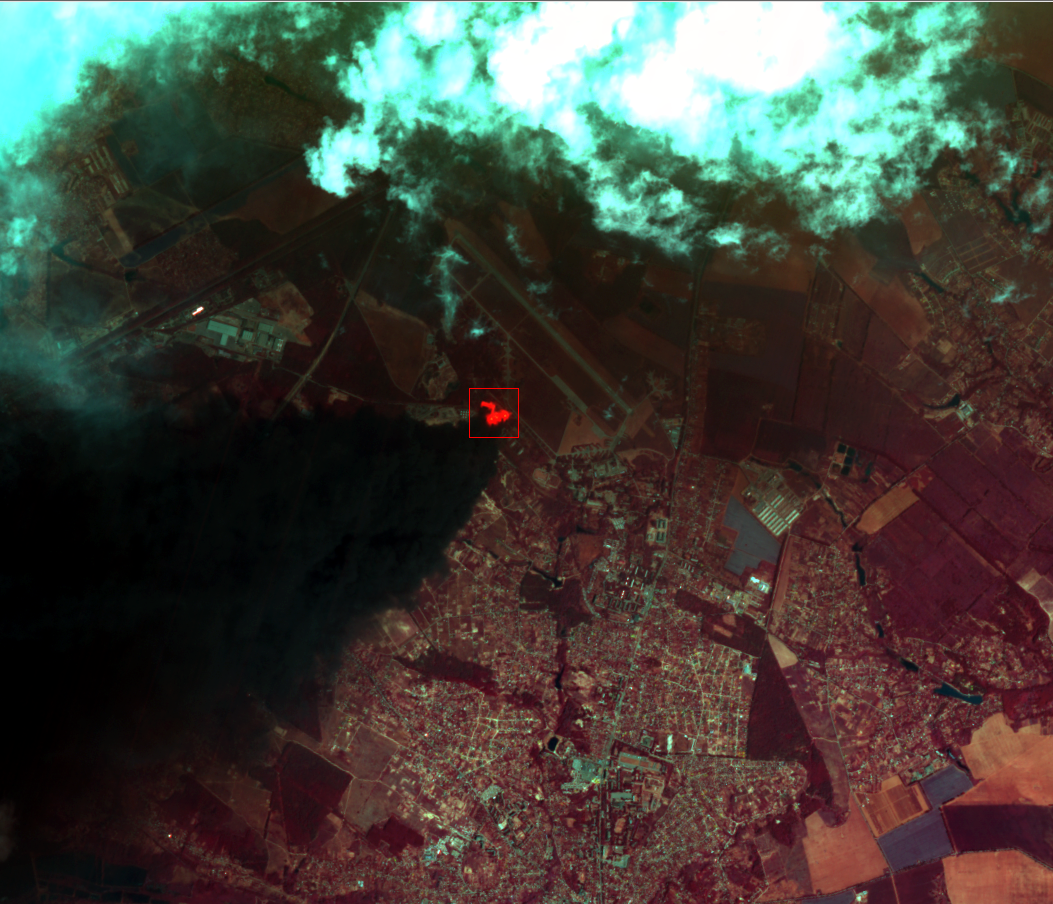
In fact, a close up on the SWIR image, which is sensitive to the thermal emission by high temperatures, shows that it is a black smoke cloud, due to a fire at the North East of the cloud. Duckduckgo gave us the answer, it was the fire of a fuel depot (which caused some casualties). Our multi-temporal methods pour cloud detection and aerosol estimates is disturbed by this dark cloud. The surface reflectance drops and then increases again, the drop is not detected as a shadow, but the subsequent increase is interpreted as a cloud. The aerosols are also inaccurately estimated, since usually, an increase of the aerosol quantity causes an increase of the reflectance, but here, the aerosol are so absorbing that the reflectance decreases.

