How long is the cooling effect of a cloud shadow ?
How long does it take for the cannon barrel to cool down after firing a shell ?
Fernand Raynaud
 =>
=>
This quote is from a famous old French funny sketch by Fernand Raynaud, which was based on a question in a French manual for soldiers: the sketch is rather long, so I’ll give you the answer : a while.
We studied here a very similar question : in the shadow of a cloud, the temperature usually drops, but when the cloud moves out, the temperature does not come back to its original value at once. How long does it take ?
I asked several specialists, as I am rather new to the TIR domain, and got several similar replies that could be taken out of Fernand’s Raynaud sketch :
- rhooo, it’s not that long
- Definitely it must be very short
- It’s a matter of seconds, I think
- Why are you asking me ?
- Why is it important ?
Well, that was not accurate enough, and the question is important because, if the delay is rather long, we would have do add a large buffer around the clouds in the TIR images, so that users don’t take a short lived temperature variation for a large evapotranspiration.
Experiment
One of the good points for a lab like CESBIO, is that we have a very motivated and efficient team devoted to in-situ measurements, instrumentation and experiments. Soon after I asked, Antoine de Launay, Clément Rémond, and Franck Granouillac had set up an experiment that was deployed in our agricultural site in Auradé. Antoine de Launay implemented everything, and was able to measure this effect during a whole summer, from May to October 2025, over a wheat field, followed by bare soil after the crop end of June.
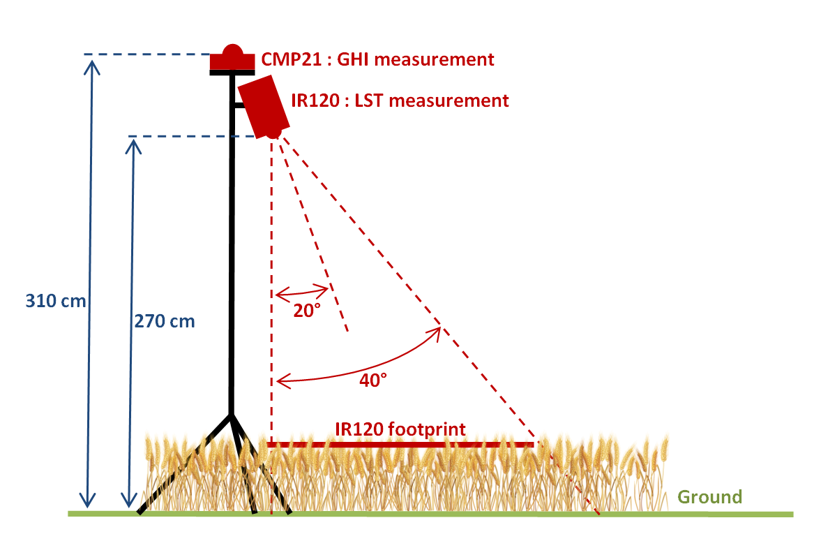
The observing station is quite simple: the instruments are on top of a 3 m high mast. They include an IR120 thermal infra-red radiometer, and a CMP21 downwelling irradiance sensor that measures the Global Horizontal irradiance (GHI). The station was installed in Auradé ICOS site (FR-AUR), and thanks to that, we benefited from an impressive amount of complementary measurements. The radiometer was high enough to observe at least 50×50 cm, event when the wheat was high

Observations
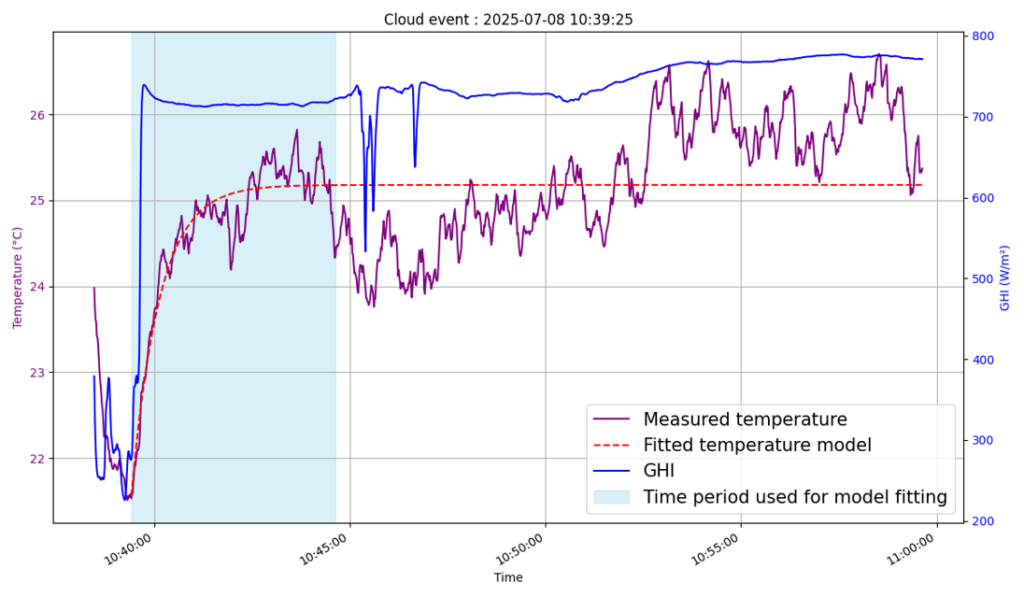
Fernand Raynaud was right, it takes a while !
The figure above shows one typical observation of a cloud overpass. The blue curve is the GHI (downwelling irradiance). It is very low at the beginning because of a cloud shadow. Highlighted in pale blue, we see the period affected by the cooling effect, during which the temperature increases. This period is not easy to determine, as temperature varies a lot with time on a field, because of wind and turbulence. We decided, but that can be criticized, to fit an exponential model, based on data acquired in a period when the GHI stays within the expected range of clear sky solar irradiance, and until the temperature doesn’t drop too much.
The duration measured there is therefore largely disturbed by temperature variations due to wind and turbulences.
Results
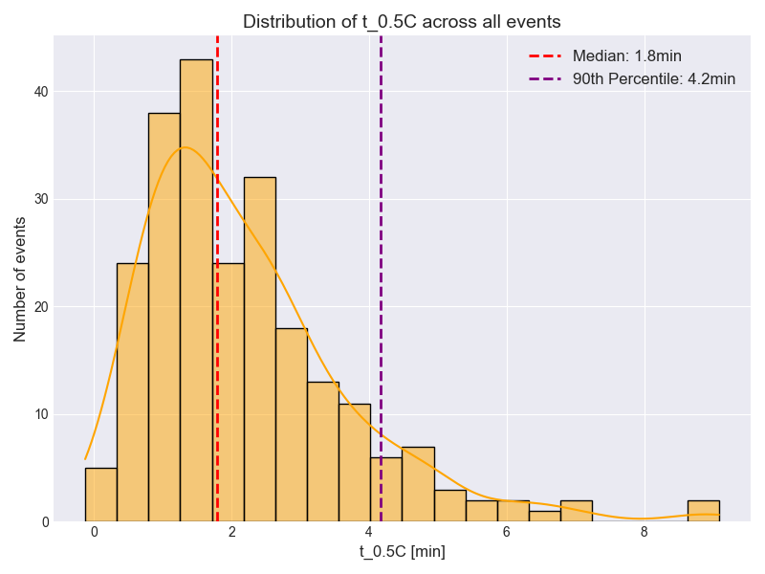
The following figure shows the distribution of durations that were observed for more than 200 cloud occurrences. The variability is very high, and probably due to the measurement perturbations due to turbulence, among other causes. However, we can see that the medium duration is definitively not a matter of seconds but a matter of minutes. The median is 1.8 minutes, and the 90% percentile reaches 4.2 mn.
We tried to explain that variability by observing the correlation with many variables. The first was the date, and the phenology of the wheat crop. It looks as if the duration had decreased after the senescence and the crop.


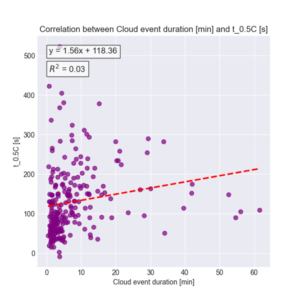


As you can see, we didn’t find any observed variable that can explain the variability of results. That’s why we believe, the main explanation lies in the wind and turbulences. SO now we’re happy, it takes a while and it depends on the wind speed.
Conclusions
We observed that the cooling effect of clouds lasts 1.8 mn (as median value). If we consider a low wind speed (5m/s or 18 km/h), the clouds have still time to move by 1.8*5*60 = 540 m, which is the length of 9 Trishna pixels. And to be on the safe side, we should even extend to the 90% percentile, which is 4.2 min, which corresponds to a displacement of 1260m (21 pixels). And to account for faster winds, we even might need to double or triple that number.
This is consistent with what we observed when trying to estimate Evapo-Transpiration with Landsat images using a contextual method. A dilation buffer of 2 km (Sarrazin et al 2025) was found necessary to avoid including outliers in the Evapo-Transpiration estimate. Of course, the cooling effect from clouds, is probably not the only reason to apply a buffer around clouds, as there may be issues with the cloud detection (difficult at the edges of the cloud), other effects such as stray-light, adjacency effects not well known in the TIR domain…
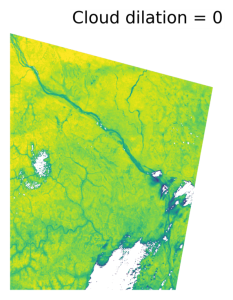
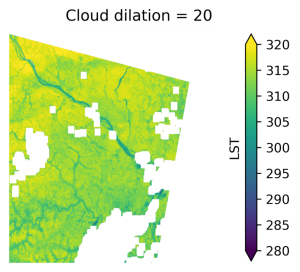
Temperature image (Landsat, over Niamey, Niger) with dilation of clouds using a 1.8 km buffer (right), and left (without any dilation). The clouds appear in white.
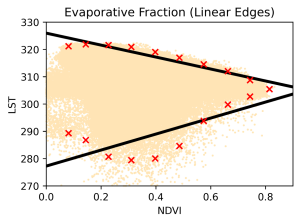
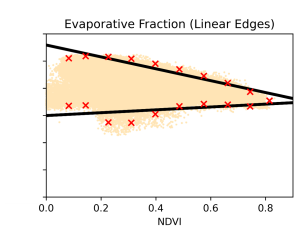
Contextual methods for ET estimate use a complete neighborhood, in the temperature, vegetation index space. They look for the cold and wet front and the hot and dry front (the black lines), to estimate the evaporative fraction, from which the ET is inferred.
References :
E. Sarrazin, G. Boulet, A. Olioso, K. Mallick, J. Demarty, J. Etchanchu, V. Rivalland, J. Auclair, S. Mwangi, N. Farhani, B. Goffin, Ph. Gamet, Benchmarking strategy for TRISHNA L2B Evapotranspiration algorithms, presented at Thermal-EO symposium, Toulouse, 2025
Mwangi, S. and Olioso, A. and Etchanchu, J. and Mallick, K. and Jia, A. and Demarty, J. and Farhani, N. and Sarrazin, E. and Gamet, P. and Roujean, J.-L. and Boulet, G., Uncertainties in long-term ensemble estimates of contextual evapotranspiration over southern France, Hydrology and Earth System Sciences, vol 30 n°4,pp 117-1142, 2026 https://hess.copernicus.org/articles/30/1117/2026/
Acknowledgements
The station was setup by Antoine de Launay, with the help of Franck Granouillac and Clement Rémond. The data were processed by Antoine de Launay, who also produced the graphics (excelpt the last ones). These results would not be available without the ICOS site of Auradé, managed by Tiphaine Tallec, and without the instrumentation team of CESBIO led by Aurore Brut. The last figures were provided by Emmanuelle Sarrazin