
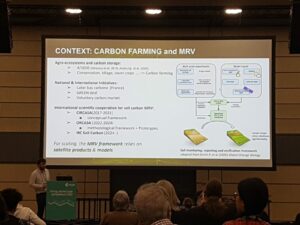
Living Planet Symposium 2022

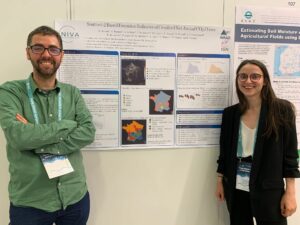
The European Space Agency’s 2022 Living Planet Symposium occurred on 23-27 May 2022 at Bonn, Germany. The advances of the team’s work were presented through an oral presentation by Taeken Wijmer and a poster by Ludovic Arnaud & Ainhoa Ihasusta.
This symposium focused on how Earth observation (from satellites) contributes to science and society, and how disruptive technologies and actors are changing the traditional Earth observation landscape, which is also creating new opportunities for public and private sector interactions.
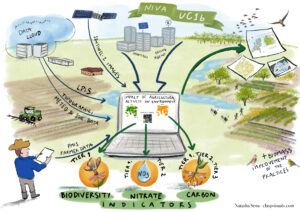
Our team is part of the H2020 New IACS Vision in Action (NIVA) project1 that is financed by the European Commission. The project aims to modernise IACS (Integrated Administrative Control System) by making efficient use of the wide range of data relevant for agriculture while reducing administrative burden for farmers, paying agencies and other stakeholders.
In the User Case 1b (UC1b) of this project, our team aims to develop several agro-environmental indicators prototypes that could be relevant for the next CAP. The development of these indicators rely on existing scientific methodologies, remote sensing and IACS data, newly developed algorithms, software designs and the output production in maps form.
Three types of indicators are concerned:
- Three indicators related to the carbon budget of agricultural parcels (details).
- An indicator that estimates the risk of nitrate leaching of agricultural parcels (details).
- An indicator that estimates the biodiversity of agricultural landscapes (details).
Each of those three indicators3 are addressed with methodologies (TIERs), that have increasing levels of complexity and precision.
Poster : Sentinel-2 Based Empirical Indicator of Cropland Net Annual CO2 Fluxes
In this poster, we focus on the Carbon indicator TIER 1 (CT1) that estimates the net annual CO2 flux of cropland, which is one of the three terms that allow the calculation of the parcels carbon budget (Smith et al. 2010) as the Carbon budget is the sum of the Net annual CO2 flux, the part of the C imported as organic amendments that has not been mineralized and the C exported at harvest (see below).
The Carbon budget is calculated as follow :
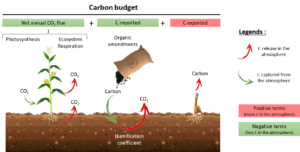
The net annual CO2 flux is of negative sign when the plot is absorbing CO2 annually.
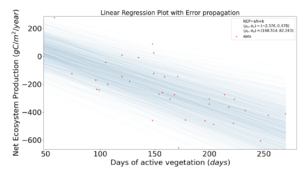
The CT1 indicator is based on the following observation2 :
- at first approximation for a whole cropping year, there is a linear relationship between the net annual CO2 flux of a parcel and the number of days the parcels are covered by active photosynthetic vegetation.
- This relationship established over 15 plots equipped with flux towers continuously monitoring CO2 fluxes over a large pedoclimatic gradient is valid for 13 crop families (i.e ; the main crop species found in Europe except rize).
The key point of the methodology is that the duration of soil coverage by active vegetation (including crops, cover crops, weeds, spontaneous regrowth) can be estimated by remote sensing.
In this context, the Sentinel-2 mission that provides systematic global acquisitions of high-resolution multi-spectral data with a high revisit frequency, was used to calculate NDVI for each date of acquisition and each pixel after filtering clouds and cloud shadows by applying the MAJA processing chain. Then the NDVI time series were interpolated on a daily basis in order to calculate the duration of active vegetation coverage at 10m resolution for croplands over several case studies (in France, Netherlands, Denmark and Spain) by considering a NDVI threshold of 0.3 below which it was considered that there was no active vegetation. Then by applying the linear relationship described above the net annual CO2 flux was estimated over those areas of study.For each test area, statistical analysis per crop specie showed results that were coherent with the literature.
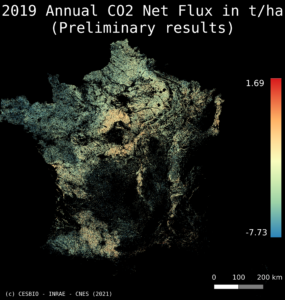
Recently, thanks to the technical support of the French Space Agency (CNES), the indicator has been successfully produced on the entire French metropolitan territory over about 9 millions of parcels by using the IOTA2 software. Preliminary results show interesting and coherent patterns in net annual CO2 fluxes such as :
- contrasts in areas dominated by winter or summer crops (the later being dominant in the very South west). As winter crops have a longer vegetation cycle than summer crops, they fix annually more CO2,
- regional differences due to the difference in implementation of cover crops in the crop rotations (e.g ; mandatory in Bretagne but less present in south east France),
- Implementation of cover crops during fallow increase the duration of soil coverage and allow fixing more CO2,
- effects of pedoclimatic conditions that affect the crop phenology.
Of course the relative simplicity of this approach raises several questions, such as the impact of a fixed threshold value for detecting soil coverage or the accuracy in clouds detection on the calculation of the duration of soil coverage. We are currently working on those issues in order to produce a good measure of uncertainties. Yet, the simplicity of this approach allows its deployment at large scale in order to produce CT1 indicators at national scale for the CAP.
References :
[2] Ceschia et al. Agriculture Ecosystems & Environment 139(3):363-383 (2010)
[3] https://gitlab.com/nivaeu/uc1b_indicators_tool
Oral presentation : Achieving 10m regional crop CO2 flux mapping in AGRICARBON-EO through a bayesian assimilation of Sentinel2 reflectances in SAFYE-CO2
Authors : Taeken Wijmer, Dr. Ahmad Al Bitar, Dr. Remy Fieuzal, Dr Ludovic Arnaud, Dr Gaetan Pique, Dr Eric Ceschia
Agriculture is at the crossroads of many challenges going from food security to biodiversity. Among those, climate change is one of the most pressing. Contributor to greenhouse gas emissions, agriculture has also a great potential for mitigating climate change, for instance through soil organic carbon (SOC) storage resulting in the 4/1000 initiative following the COP21 (Minasny et al., 2017). In order to guide the transition to sustainable agricultural practices and quantify their effects, comprehensive and scalable tools for regional monitoring of the local impacts of agronomic practices on soil organic carbon storage are needed.
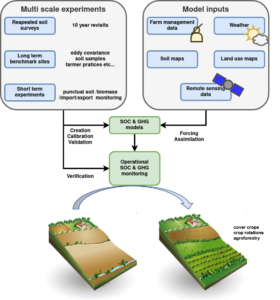
In this context, assimilation of remote sensing data in agronomic models is a promising way to retrieve agro-environmental indicators (biomass production, water requirements, CO2 fluxes) meeting the needs of precision farming and large-scale monitoring of agroecosystems carbon budgets components. However, agronomic modelling exercises covering all of these processes are either limited to demonstrations over fairly small areas (hundreds of square km) at high resolution, or low to medium resolution over large areas, due to computational constraints. This curbs their potential to inform policy makers at regional/national scales of the country in the first case, and is inadequate when aiming to
monitor the impact of management at plot/farm scale in the second. Furthermore, most of these approaches when applied over small areas provide plot scale estimates, while an intra-plot estimate can be needed to represent process heterogeneity. This is especially true in regions with high soil variability or crops sensitive to environmental variations. Intra-plot scale estimates meet the needs of precision agriculture, while allowing validation of the cropland carbon budget components (measurements and estimates being performed at a consistent spatial scale).
In this study, we will address those challenges by providing an adequate scalable solution to estimate the daily CO2 fluxes and the components of the carbon budget at high spatial resolution. The SAFYE-CO2 agronomic model (Pique et al., 2020a, 2020b) is applied at 10×10 m² resolutions, over an entire Sentinel-2 tile that covers a 110×110 km² area.
SAFYE-CO2 is a simple parsimonious agronomic model that relies on the Monteith method to represent photosynthesis, on Amthor, 2000 to estimate autotrophic respiration, and on the FAO-56 method for water budget and evapotranspiration estimates.
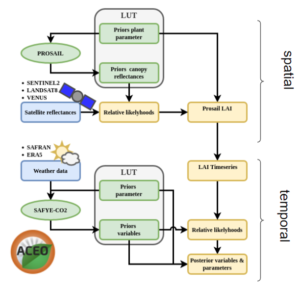
Former applications of SAFYE-CO2 relied on iterative hard to scale least square error reduction optimization functions to assimilate remote sensing derived LAI time series, in order to calibrate light use efficiency and the phenological parameters in the model. Here, the previously inconceivable large scale exercise is made possible through a spatialised assimilation strategy, that combines the use of importance sampling and look up tables at the resolution of the weather forcing data.
This strategy and the SAFYE-CO2 model have been implemented in the Agricarbon-EO agronomic modelling platform because :
- it provides 10m resolution multitemporal LAI data derived from Sentinel-2 images through a bayesian inversion of the prosail radiative transfer model,
- the LAI is assimilated at pixel level in the SAFE-CO2 model to provide dry biomass and daily CO2 flux estimates.
The Agricarbon-EO modelling platform includes automated connections to the ERA5, Theia and Global soil map api’s to extract relevant data and to manage the data flow between the different modules in a parallel computation setup. This architecture allows an end-to-end comprehensive solution. End-to-end designates here the process that goes from the download of satellite reflectance products to production of maps such as the harvested yield map or the cumulated CO2 flux maps.
Agricarbon-EO is applied to an agricultural area located in the South-west of France. This zone is characterized by a hilly landscape with medium size plots (5 to 50 ha) and a high degree of soil variability due to post glacial erosion in the Garonne river bassin. It is also a highly monitored zone with 2 ICOS flux sites (Lamasquère, Auradé) managed by the Regional Spatial Observatory (ORS) that provides regular destructive biomass and LAI measurements on a network of plots near the ICOS towers.
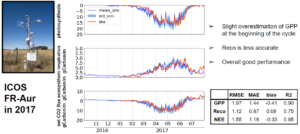
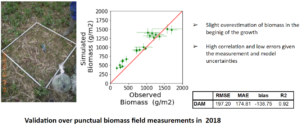
Results show that we are able to process about 300 pixels/min compared to 0.2 pixels/min in the previous iterative approach, which gives a x1500 computational gain. Moreover this approach can be parallelised with a less than 5Gb RAM load per process which allows efficient deployment on modern HPC. Most importantly, the accuracy of the predictions for winter wheat are not hampered by this computational gain (RMSE of 200 g.m-2 R²=0.92 for dry aboveground biomass as in Pique et al., 2020). In addition, the new approach provides not only the estimates but also their associated uncertainties (we observe a coefficient of variation +/-0.2 for dry aboveground biomass for example) which are needed for the elaboration of new guidelines for improving SOC storage and for the carbon market.
This study illustrates the potential of pixel scale agronomical modelling based on the assimilation of LAI time series at full Sentinel-2 resolution and over large areas while :
- maintaining statistical performance obtained at plot level in previous modelling exercises on the components of the carbon budget (yield, biomass, CO2 fluxes) and
- providing local estimates of their uncertainties.
These improvements pave the way to more accurate and comprehensive monitoring of the components of the cropland carbon budgets and other agro-environmental indicators.
Références:
How to measure, report and verify soil carbon change to realize the potential of soil carbon sequestration for atmospheric greenhouse gas removal – Smith et al., 2020 – Global Change Biology
Soil carbon 4 per mille – Minasny et al., (2017) – Geoderma
Estimation of daily CO2 fluxes and of the components of the carbon budget for winter wheat by the assimilation of Sentinel 2-like remote sensing data into a crop model – Pique et al., 2020a – Geoderma
Combining High-Resolution Remote Sensing Products with a Crop Model to Estimate Carbon and Water Budget Components: Application to Sunflower – Pique et al., 2020b – Remote Sensing