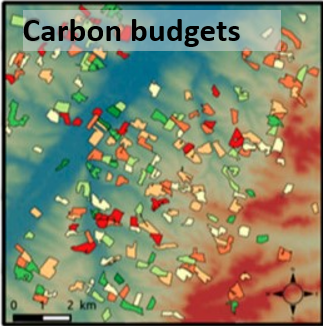
A strategy for estimating the components of the carbon and water budgets for croplands at plot scale over large areas.
Eric Ceschia, Gaétan Pique, Valérie Demarez, Amanda Veloso, Rémy Fieuzal (2018)
ICOS Science Conference (Praque, Czech Republic),
Developing diagnostic tools for assessing C and water budgets, monitor crop production at the plot scale over large areas (region, country) is essential for guiding the transition of conventional agriculture toward more sustainable practices.
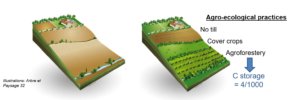
We propose here a regional modeling approach that combines high spatial and temporal resolutions (HSTR) remote sensing data, a simple crop model and in-situ flux data for model’s validation. This approach could be applied at European scale in a near future thanks to the new Sentinel satellite constellation.
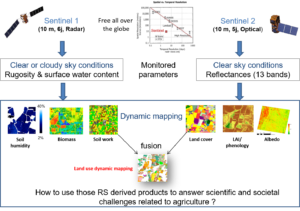
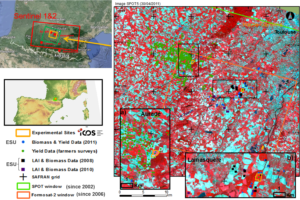
The model, called SAFYE-CO2 is a daily time step model based on Monteith’s light-use efficiency theory and coupled with a water budget module (FAO-56 method). SAFYE-CO2 estimates the components of the carbon and water budgets and also time courses of dry aboveground biomass and yield. Crop and soil model parameters were determined using both in-situ measurements and values found in the literature.The phenological parameters and the light use efficiency were calibrated by comparing the Green Area Index (GAI) simulated by the model with the GAI dynamics estimated from satellite observations. For this work, we used a unique set of Sentinel 2 like data (Formosat-2 and SPOT) images acquired from 2006 to 2011 in southwest France.
The results indicate that the model is able to correctly reproduce the biomass and yield production (relative error about 25%) for years with contrasted climatic conditions. The estimated net carbon flux components were overall in agreement with the measurements, presenting very good correlations (R² about 0.9 for GPP, 0.77 for Reco and 0.84 for NEE).
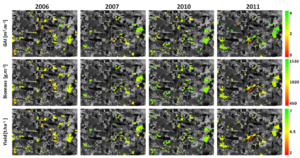
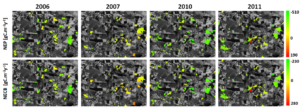
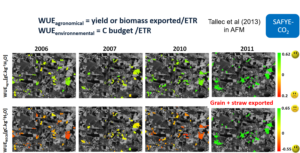
Carbon and water budgets, as well as some water use efficiency (WUE) indices were computed, allowing to evaluate the crop ecosystems in terms of environmental and agronomical aspects.
The performances of this method was improved by considering weeds or re-growths events after harvest (dark blue curves).
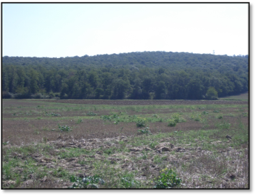
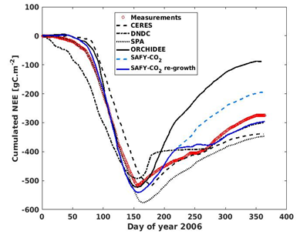
with re-growths/without re-growths
